
คำอธิบาย
MarketSessions – ขอบเขตการเทรดของคุณ ถูกแสดงออกมาอย่างชัดเจน
เปลี่ยนเวลาตลาดให้เป็นพลังการเทรด
MarketSessions คืออินดิเคเตอร์ระดับมืออาชีพสำหรับ cTrader ที่ทำให้ช่วงเวลาตลาดทั่วโลกมีชีวิตชีวา — เพื่อให้คุณสามารถเทรดในที่ที่ โมเมนตัมเป็นเรื่องจริง และเวลาคือข้อได้เปรียบของคุณ
🚀 ทำไมเทรดเดอร์ถึงไว้วางใจ MarketSessions
เห็นจังหวะของตลาด
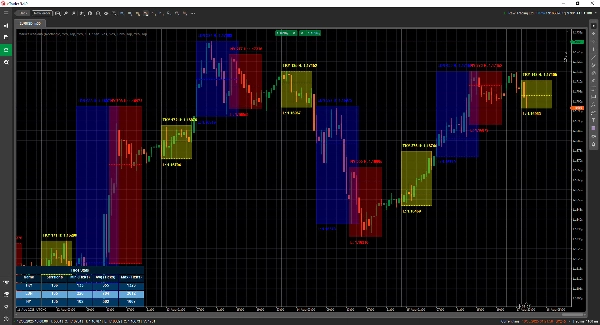
แสดงภาพลอนดอน นิวยอร์ก โตเกียว ซิดนีย์ – และช่วงเวลาอื่นๆ ที่คุณต้องการ – ด้วยการซ้อนทับที่สะอาดและสง่างามที่ปรับให้เข้ากับกราฟของคุณ
เทรด อย่างชาญฉลาด ไม่ใช่ช้า
รับการแจ้งเตือนแบบเรียลไทม์เมื่อช่วงเวลาเปิด ปิด หรือถึงระดับสำคัญ – ส่งผ่าน Telegram หรือ Discord (ตามที่คุณเลือก)
โจมตีโซนที่มีความน่าจะเป็นสูง
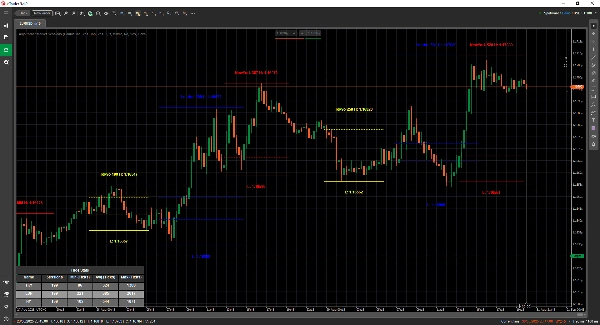
ใช้เครื่องมือในตัวเช่น Opening Range Breakout, Point of Control (POC) และ เส้นช่วงเวลาที่แม่นยำ เพื่อให้คุณไม่พลาดการเบรคเอาท์หรือการปฏิเสธ
🎯 คุณสมบัติหลัก
- การแสดงผลและการจัดการช่วงเวลา – กำหนดเวลาที่กำหนดเองได้เต็มที่ สี และป้ายชื่อ แม้กระทั่งสำหรับตลาดที่ทับซ้อนกัน
- เครื่องมือวาดขั้นสูง – รวมถึงเครื่องมือวาด Double ❘❘ และเส้นกลาง, สี่เหลี่ยมเบรคเอาท์, เครื่องหมายข้อความ และ โหมดเส้นคู่ สำหรับเทรดเดอร์ที่ชอบความเรียบง่าย
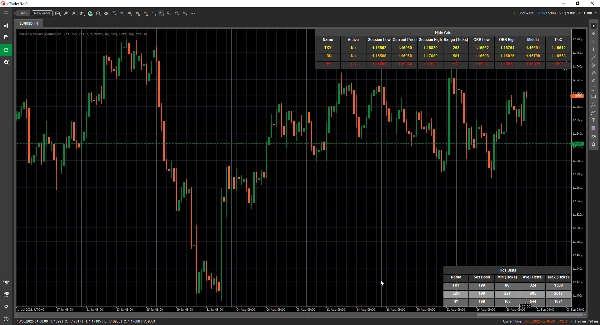
- แผงสถิติ – ดูจำนวนช่วงเวลาทั้งหมด ช่วงต่ำสุด ค่าเฉลี่ย และสูงสุดสำหรับแต่ละช่วงเวลา (ใน Ticks, Pips หรือ %)
- โหมดกริด - ช่วยให้คุณดูช่วงเวลาที่ใช้งานอยู่ในตาราง เพื่อให้เห็นช่วงเวลาในกรอบเวลาที่สูงขึ้น
- การตั้งค่าที่ยืดหยุ่น – ปรับแต่งตำแหน่งข้อความ โหมดช่วงเวลา ความชอบในการวาด และธีม
- การแจ้งเตือนและการรวมระบบ – การรวม Telegram/Discord พร้อมเสียงและการแจ้งเตือนภาพ
📦 สิ่งที่คุณจะได้รับ
- MarketSessions.algo (พร้อมใช้งาน)
- อัปเดตตลอดชีพ (ไม่มีค่าธรรมเนียมซ้ำ)
- การสนับสนุนที่เป็นมิตร (เข้าถึงโดยตรงหากคุณต้องการความช่วยเหลือ)
💻 ความต้องการ
- แพลตฟอร์ม cTrader
- .NET 6.0 runtime
✅ ติดตั้งได้ภายในไม่กี่นาที
✅ เทรดด้วยความมั่นใจอย่างเต็มที่
📘 เอกสารอ้างอิงพารามิเตอร์ (เวอร์ชันเป็นมิตร)
รายการช่วงเวลาที่มีให้
- นิวยอร์ก
- ลอนดอน
- แฟรงก์เฟิร์ต
- โตเกียว
- ฮ่องกง
- เซี่ยงไฮ้
- สิงคโปร์
- เวลลิงตัน
- ซิดนีย์
- โตรอนโต
การตั้งค่าทั่วไป
- โหมดการวาด – เลือกวิธีการวาดเส้นช่วงเวลาบนกราฟ (สี่เหลี่ยม / เส้นคู่ / เส้นกลาง)
- แสดงชื่อช่วงเวลา – แสดงชื่อของแต่ละช่วงเวลาบนกราฟของคุณโดยตรง
- ตำแหน่งชื่อช่วงเวลา – กำหนดตำแหน่งที่ข้อความชื่อช่วงเวลาปรากฏ (บน, กลาง, ล่าง)
- ข้อความตัวหนา – ทำให้ชื่อช่วงเวลาเป็นตัวหนาเพื่อให้อ่านง่ายขึ้น
- การเลื่อนข้อความด้านบน – เพิ่มช่องว่างเพิ่มเติมจากด้านบน (เพื่อไม่ให้ข้อความทับซ้อนกับแท่งเทียน)
- การเลื่อนข้อความด้านล่าง – เพิ่มช่องว่างเพิ่มเติมจากด้านล่างของพื้นที่ช่วงเวลา
- ตำแหน่งเวลาข้อความ – แสดงเวลาช่วงเวลาพร้อมกับชื่อช่วงเวลา
- ใช้ชื่อช่วงเวลาสั้น – เปลี่ยนเป็นชื่อสั้น (เช่น NY แทน นิวยอร์ก)
- แสดงช่วงเวลาช่วงราคา – เน้นช่วงราคาทั้งหมดที่ครอบคลุมโดยช่วงเวลา
- โหมดช่วงเวลาช่วงราคา – เลือกวิธีการคำนวณช่วงราคา (สูง/ต่ำ หรือ เปิด/ปิด)
- ตำแหน่งช่วงเวลาช่วงราคา – วางเครื่องหมายช่วงเวลาไว้ที่ด้านบนหรือล่างของช่วงราคา
- แสดงราคาสูงสุด – แสดงราคาสูงสุดของช่วงเวลา
- ตำแหน่งแสดงราคาสูงสุด – เลือกตำแหน่งที่ป้ายราคาสูงสุดปรากฏ
- แสดงราคาต่ำสุด – แสดงราคาต่ำสุดของช่วงเวลา
- ตำแหน่งแสดงราคาต่ำสุด – เลือกตำแหน่งที่ป้ายราคาต่ำสุดปรากฏ
- ขยายเส้นสูง/ต่ำ (นาที) - อนุญาตให้ขยายเส้นเหล่านี้ไปข้างหน้าจำนวน x นาที
- แสดง Opening Range Breakout – วาดกล่องเบรคเอาท์ที่ช่วงเวลาเปิด
- ขยายเส้น ORB (นาที) - อนุญาตให้ขยายเส้นเหล่านี้ไปข้างหน้าจำนวน x นาที
- แสดงเส้นกลาง – เพิ่มเส้นกลางเพื่อช่วยระบุมูลค่ายุติธรรม
- ขยายเส้นกลาง (นาที) - อนุญาตให้ขยายเส้นนี้ไปข้างหน้าจำนวน x นาที
- แสดง PoC – แสดง Point of Control (ราคาที่มีการเทรดมากที่สุดในช่วงเวลา)
- ขยายเส้นกลาง (นาที) - อนุญาตให้ขยายเส้นนี้ไปข้างหน้าจำนวน x นาที
- ความโปร่งใสของการเติมสี – ควบคุมความโปร่งใสของพื้นหลังในช่วงเวลา
สถิติ
- วาดสถิติ – แสดง/ซ่อนแผงสถิติบนกราฟของคุณ
- การจัดแนวแนวนอนของสถิติ – จัดแนวแผง (ซ้าย / กลาง / ขวา)
- การจัดแนวแนวตั้งของสถิติ – เลือกว่าจะแสดงแผงด้านบนหรือล่าง
- สีหัวข้อ – สีข้อความสำหรับหัวข้อ “สถิติ”
- สีแถวคู่ – สีพื้นหลังสำหรับแถวเลขคู่ในแผง
- สีแถวคี่ – สีพื้นหลังสำหรับแถวเลขคี่ในแผง
- สีหน้า – สีข้อความที่ใช้ภายในแผง
Telegram
- ใช้งาน – เปิดหรือปิดการแจ้งเตือน Telegram
- โทเค็น – โทเค็นบอท Telegram ของคุณ
- ChatId – รหัสแชทที่ส่งการแจ้งเตือน
Discord
- ใช้งาน – เปิดหรือปิดการแจ้งเตือน Discord
- WebhookUrl – URL webhook ของ Discord สำหรับส่งการแจ้งเตือนช่วงเวลา
เสียงแจ้งเตือน
- เสียงแจ้งเตือนช่วงเวลาใหม่ – เล่นเสียงเมื่อช่วงเวลาใหม่เริ่มต้น
- เสียงแจ้งเตือนช่วงเวลาสิ้นสุด – เล่นเสียงเมื่อช่วงเวลาสิ้นสุด
กริด
- บังคับกริด - บังคับให้แสดงกริดไม่ว่าจะใช้ TimeFrame ใด
- กริดแสดงสำหรับ TimeFrame ขึ้นไป - ให้คุณเลือก TimeFrame ที่กริดจะแสดงและสูงกว่านั้น
- การแจ้งเตือนกล่องข้อความ - แจ้งเหตุผลที่โหมดการแสดงผลปกติไม่สามารถใช้ได้และสลับไปโหมดกริด
- การจัดแนวกริดแนวนอน
- การจัดแนวกริดแนวตั้ง
ตัวอย่างช่วงเวลา (นิวยอร์ก)
⚠️ พารามิเตอร์เดียวกันนี้ใช้กับแต่ละช่วงเวลา (ลอนดอน โตเกียว ซิดนีย์ ฯลฯ)
- เปิดใช้งาน – เปิดหรือปิดช่วงเวลานี้โดยเฉพาะ
- สี – สีช่วงเวลาที่ใช้บนกราฟ
- เติมพื้นที่ – เติมพื้นหลังของพื้นที่ช่วงเวลา
- สไตล์เส้น – เลือกสไตล์เส้น (ทึบ, ขีดเส้น ฯลฯ)
- ความหนาของเส้น – ควบคุมความหนาของขอบช่วงเวลา
ทำให้นาฬิกาตลาดเป็นพันธมิตรของคุณ
รับ MarketSessions วันนี้และอย่าพลาดช่วงเวลาที่ทำกำไรอีกเลย
สรุป
Users can view comprehensive session statistics, including total sessions, minimum, average, and maximum ranges measured in ticks, pips, or percentages. A grid mode enables viewing active sessions in a table format suitable for higher timeframes. The indicator supports real-time alerts via Telegram or Discord for session openings, closings, and key levels, complemented by sound and visual notifications.
Additional configurable options include display preferences for session names, price ranges, high/low prices, opening range breakouts, middle lines, and the Point of Control (most traded price). The indicator requires the .NET 6.0 runtime and offers lifetime updates and support. It is applicable to major forex symbols such as EURUSD, GBPUSD, NZDUSD, and USDJPY.
รีวิวจากลูกค้า
5 | 100 % | |
4 | 0 % | |
3 | 0 % | |
2 | 0 % | |
1 | 0 % |


