
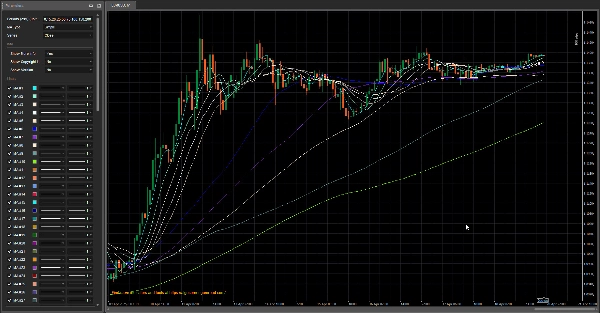
AlgoCorner 1-100 Moving Averages
Indicateur
137 téléchargements
Version 1.1, Jan 2026
Windows, Mac
5.0
Avis : 1
Description
Cet indicateur vous aide à tracer de nombreuses moyennes mobiles simplement en tapant les périodes dans un CSV (format valeurs séparées par des virgules), et jusqu'à 100 moyennes mobiles sont autorisées.
Au lieu d'ajouter les moyennes mobiles une par une, vous pouvez utiliser cet outil pratique pour en tracer beaucoup avec peu d'effort.
Les 100 sont entièrement personnalisables.
La couleur de chaque MM est triée par ordre alphabétique.
Résumé
Profil de l'indicateur
Avis clients
5.0
Avis : 1
5 | 100 % | |
4 | 0 % | |
3 | 0 % | |
2 | 0 % | |
1 | 0 % |
Avis clients
October 2, 2025
Love MAs? This tool lets you stack up to 100 on your chart! Great for trend hunting and system testing. Just don’t overload it – too many lines can turn your chart into spaghetti.
Discussion
Questions fréquentes
Forex
Signal
Supertrend
Les produits disponibles sur cTrader Store, notamment les bots de trading, les indicateurs et les plug-ins, sont fournis par des développeurs tiers et mis à disposition à titre informatif et à des fins d'accès technique uniquement. cTrader Store n'est pas un courtier et ne fournit aucun conseil en investissement, aucune recommandation personnelle ni aucune garantie quant aux performances futures.


Prix
10
Ventes
346
Installations gratuites