Description
Force de la paire (JPY) - Indicateur de force des devises
📊 Qu'est-ce que la Force de la paire (JPY) ?
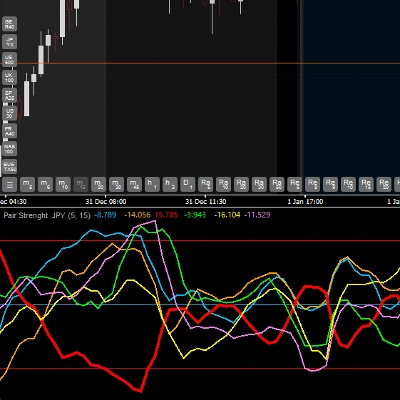
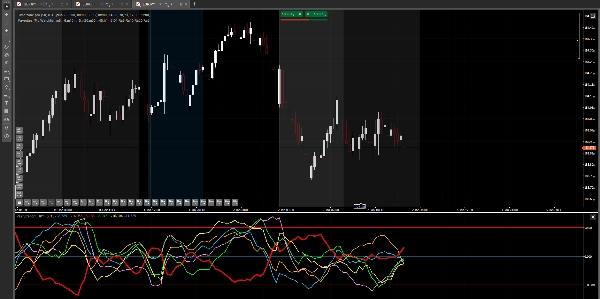
La Force de la paire (JPY) est un indicateur avancé qui analyse et compare la force relative de 6 devises majeures en temps réel : EUR, GBP, JPY, USD, AUD et CAD. Il utilise le True Strength Index (TSI) pour mesurer le momentum et la force de chaque devise, vous permettant d'identifier quelles devises sont plus fortes ou plus faibles sur le marché.
🎯 Principales fonctionnalités
✅ Analyse multi-devises : Surveillez 6 devises simultanément dans une seule fenêtre ✅ Identification de tendance : Détectez les devises les plus fortes et les plus faibles du marché ✅ Signaux de surachat/survente : Niveaux à 50, 0 et -50 pour identifier les extrêmes ✅ Confirmation de trade : Aide à valider vos entrées en comparant la force relative ✅ Visuel et clair : Chaque devise a sa propre couleur pour une identification facile
💹 Paires compatibles
IMPORTANT : Cet indicateur analyse la force de 6 devises : EUR, GBP, JPY, USD, AUD et CAD
L'indicateur fonctionne UNIQUEMENT avec des paires incluant JPY (Yen japonais), c'est-à-dire :
- EURJPY (Euro / Yen)
- GBPJPY (Livre / Yen)
- USDJPY (Dollar / Yen)
- AUDJPY (Dollar australien / Yen)
- CADJPY (Dollar canadien / Yen)
⚠️ Votre courtier DOIT proposer ces 5 paires avec JPY pour que l'indicateur fonctionne correctement.
Ne fonctionne PAS avec :
- L'or, l'argent ou autres métaux
- Indices boursiers
- Cryptomonnaies
- Paires qui n'incluent pas JPY (comme EURUSD, GBPUSD, etc.)
Vous pouvez appliquer l'indicateur sur le graphique de n'importe laquelle des 5 paires mentionnées ci-dessus.
📈 Comment utiliser l'indicateur
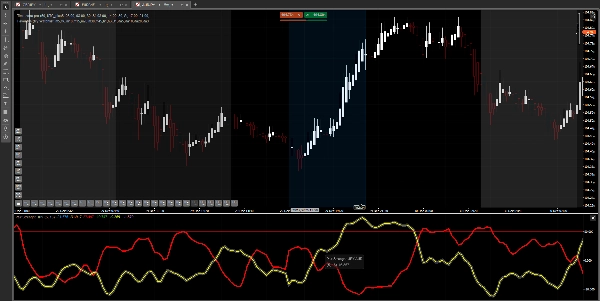
Interprétation des lignes :
Chaque ligne colorée représente la force d'une devise :
- Ligne vers le haut (valeurs positives) : La devise est FORTE
- Ligne vers le bas (valeurs négatives) : La devise est FAIBLE
- Croisements de lignes : Changement de force relative entre les devises
Niveaux clés :
- Niveau 50 : Zone de surachat - La devise peut être très forte et proche d'un retournement
- Niveau 0 : Ligne neutre - Équilibre entre force et faiblesse
- Niveau -50 : Zone de survente - La devise peut être très faible et proche d'un retournement
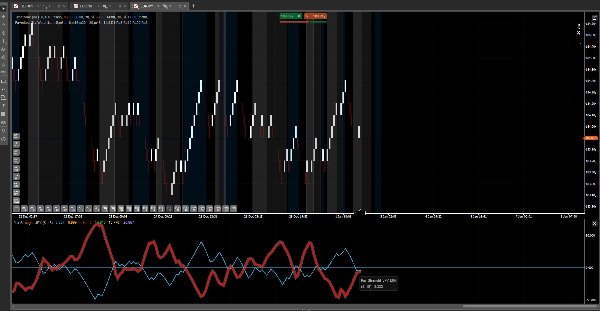
Stratégie de base :
- Identifier la devise la PLUS FORTE (ligne la plus haute)
- Identifier la devise la PLUS FAIBLE (ligne la plus basse)
- Trader la paire combinant les deux (exemple : si EUR est fort et JPY est faible → acheter EURJPY)
- Confirmer avec les niveaux : Évitez d'acheter lorsque la devise forte est à +50 ou de vendre lorsque la faible est à -50
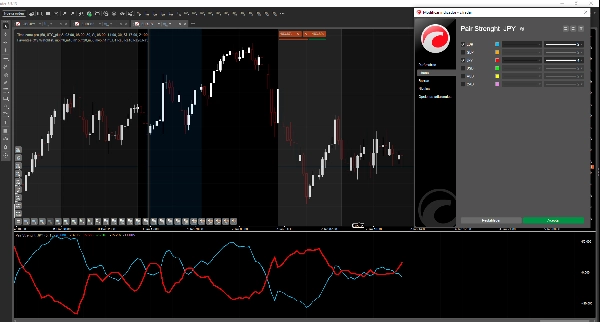
⚙️ Paramètres ajustables
- Période rapide (Par défaut : 5) : Période rapide du TSI - valeurs plus basses = plus sensible
- Période lente (Par défaut : 15) : Période lente du TSI - valeurs plus élevées = plus lisse
Les valeurs par défaut fonctionnent bien dans la plupart des situations. Ajustez-les selon votre style de trading.
🔮 Mises à jour futures
Nous évaluons la possibilité d'ajouter plus de paires de devises (NZD, CHF, etc.) dans les futures versions, en fonction des retours et de la réponse des utilisateurs. Cependant, cela n'est pas garanti et dépendra des performances de l'indicateur et de la demande du marché.
💡 Conseils d'utilisation
✓ Utilisez-le en conjonction avec votre stratégie principale, pas comme un système autonome ✓ Combinez avec l'analyse de l'action des prix et les niveaux de support/résistance ✓ Entraînez-vous d'abord sur un compte démo avant de trader en réel ✓ Toutes les signaux ne sont pas gagnants - appliquez une gestion des risques appropriée ✓ Fonctionne mieux sur les unités de temps M15 et supérieures
📞 Support
Si vous avez des questions sur l'installation ou l'utilisation de l'indicateur, contactez-nous.
Note finale : Cet indicateur est un outil d'analyse. Le succès en trading dépend de multiples facteurs, y compris la gestion des risques, la psychologie et l'expérience.
Résumé
This tool works exclusively with currency pairs that include the Japanese Yen (JPY), specifically EURJPY, GBPJPY, USDJPY, AUDJPY, and CADJPY. It does not support metals, stock indices, cryptocurrencies, or pairs without JPY. Users apply the indicator on any of the five JPY pairs to monitor multi-currency strength simultaneously in one window.
Adjustable parameters include the fast and slow periods of the TSI for sensitivity and smoothing. The indicator aids in trend identification, overbought/oversold signal detection, and trade confirmation by comparing relative currency strength. It is recommended for use alongside other analysis methods and on timeframes of 15 minutes or higher.
Avis clients
5 | 100 % | |
4 | 0 % | |
3 | 0 % | |
2 | 0 % | |
1 | 0 % |


![Logo de "[Hamster-Coder] Pivot Points MTF"](https://cdn.ctrader.com/image/webp/4c143e5a-309c-40e3-a578-f04d1e133ffa_31159)


