
Description
Indicateur Professionnel Footprint & Delta pour cTrader
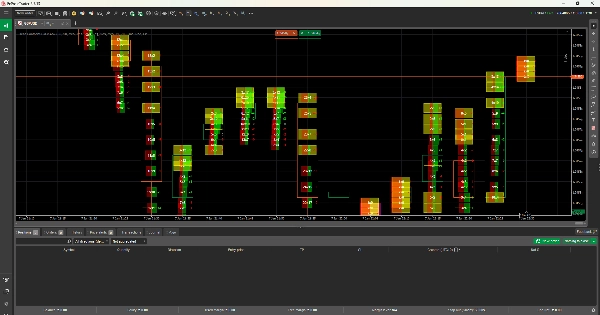
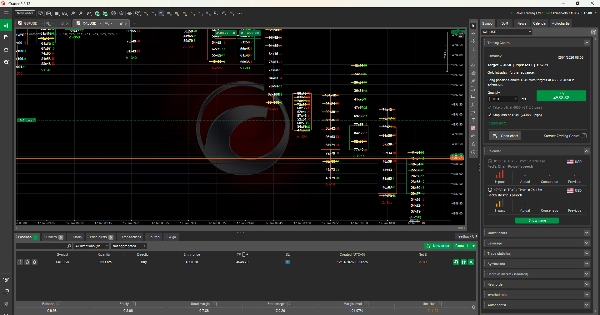
Cet indicateur Footprint pour cTrader lit les données de tick réelles pour montrer comment les acheteurs et les vendeurs interagissent à chaque niveau de prix. Il affiche le volume, le delta bid/ask, et les déséquilibres, aidant les traders à voir clairement qui contrôle le marché.
Construit en utilisant les concepts de Market Profile et Volume Profile, l'indicateur met en évidence les zones d'activité élevée, les zones de valeur, et un support ou une résistance forts. Au lieu de deviner uniquement à partir du prix, les traders peuvent prendre des décisions basées sur le volume réellement échangé et le flux d'ordres.
Parfait pour le scalping et le trading intrajournalier, cet outil donne aux utilisateurs de cTrader un avantage professionnel en révélant la véritable histoire derrière le mouvement des prix.
Cet indicateur vous aide à comprendre ce qui se passe réellement à l'intérieur de chaque chandelier. Il lit les données de tick et montre combien d'acheteurs et de vendeurs ont échangé à chaque prix.
Vous pouvez clairement voir :
- Où les acheteurs sont plus forts
- Où les vendeurs sont plus forts
- Quand le momentum augmente ou ralentit
L'indicateur montre également le delta, ce qui signifie la différence entre la pression d'achat et de vente. Il est construit en utilisant Market Profile et Volume Profile, vous permettant ainsi de repérer facilement les zones de prix importantes où le marché réagit.
Cela rend le trading plus facile pour les débutants car vous n'avez pas à deviner. Vous pouvez voir le volume réel et l'activité réelle du marché, pas seulement des indicateurs basés sur le prix.


![Logo de "Wyckoff Toolkit [Iridio Capital]"](https://cdn.ctrader.com/image/webp/8acfe6a1-6a8e-4578-9367-9df3af2b1801_27763)


