Description
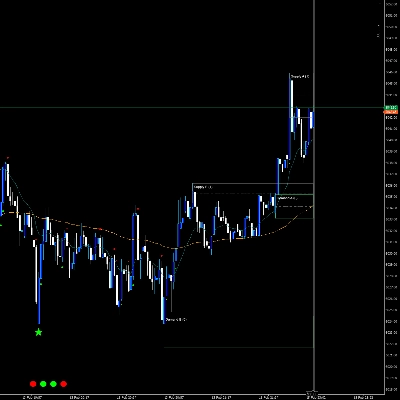
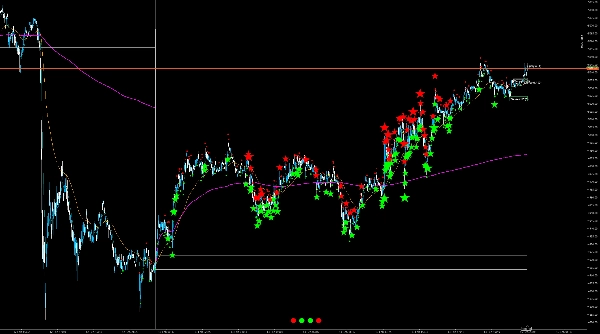
Un indicateur compact de scalping pour cTrader qui combine trois éléments en une seule superposition claire : un VWAP quotidien basé sur la session, un guide d’Opening Range, des bulles « delta/puissance » comme marqueurs de momentum/activité, et des zones dynamiques d’offre/demande avec statut test/confirmation plus un filtre de tendance optionnel. De plus, il inclut un feu tricolore multi-échelles de temps qui montre, en un coup d’œil, la direction de la dernière bougie fermée sur plusieurs échelles de temps (VWAP + Opening Range).
Note : Les paramètres sont conçus intentionnellement pour que vous puissiez rapidement adapter l’outil à votre marché/échelle de temps ; la logique s’exécute automatiquement en arrière-plan.
Ce que vous obtenez (fonctionnalités)
- VWAP quotidien (réinitialisé chaque jour de trading) : Visualise le « prix de session » équitable et aide à la réversion vers la moyenne, aux retracements et au biais directionnel
- Haut/bas de l’Opening Range (OR) : Trace la plage d’ouverture pour que vous puissiez structurer des configurations de cassure/inversion (minutes définies automatiquement ou manuellement)
- Bulles Delta/Puissance : Mettent en évidence les bougies avec une activité supérieure à la moyenne (selon le mode : pic de volume, volume corps/plage, ou un proxy delta) et les colorent selon la direction (haussière/baissière)
- Zones d’offre/demande (deux ensembles de pivots A/B) : Zones automatiques à partir des hauts/bas de pivot confirmés, avec profondeur de zone basée sur l’ATR, une extension définie côté droit, et une ligne médiane optionnelle
- Statut de la zone : « Fraîche → Testée → Confirmée » (confirmation optionnelle via une condition de volume) pour que vous puissiez voir immédiatement si une zone a déjà été tradée et si elle a réagi avec force
- Filtre de tendance (optionnel) : Filtre EMA ou EMA+ADX pour que les zones ne soient affichées/considérées que dans la direction de la tendance (par exemple, zones de demande uniquement en tendance haussière)
- Feu tricolore multi-échelles : Affiche M1/M5/H1/D1 en vert/rouge/gris selon la dernière bougie fermée — contexte utile sans changer d’échelle de temps du graphique
Ce que les acheteurs peuvent configurer (aperçu des paramètres)
Les réglages sont regroupés et délibérément pratiques :
Noyau
- Longueur ATR : Entrée de base pour la profondeur de zone et certaines métriques des bulles
- Afficher VWAP quotidien : Activé/Désactivé
- Afficher Opening Range : Activé/Désactivé
- Mode OR : Auto (dépend de l’échelle de temps du graphique) ou Manuel (minutes fixes)
- Facteur auto OR / minutes OR : Affine la durée de l’OR
Filtre de tendance
- Mode : Désactivé / EMA / EMA+ADX
- EMA rapide / EMA lente : Direction de la tendance via croisement/relation EMA
- Longueur + seuil ADX : Force minimale de la tendance quand EMA+ADX est activé
- Tracer les lignes EMA : Affiche optionnellement les EMA du filtre sur le graphique
Bulles
- Afficher les bulles : Activé/Désactivé
- Proxy delta : Trois variantes (pondéré par la plage, clôture vs précédent, clôture vs ouverture) selon l’instrument/feed
- Métrique bulle : Auto ou métrique fixe (delta absolu, pic de volume, volume corps/plage)
- Retour en arrière quantile + % quantile : Contrôle la rareté d’un signal bulle (plus haut % = uniquement événements plus forts)
- Limite d’étiquettes : Nombre d’étiquettes de bulles restantes sur le graphique (performance/clarité)
- Police de base + mode 4K : Mise à l’échelle visuelle pour écrans haute résolution
- Glyphe petit/grand : Forme de la bulle (point/cercle, etc.)
- Débogage : Forcer les bulles (test uniquement)
Zones
- Afficher les zones : Activé/Désactivé
- Profondeur de zone × ATR : Épaisseur de la zone (adaptative à la volatilité)
- Extension (barres) : Jusqu’où les zones s’étendent vers la droite
- Afficher la ligne médiane : Activé/Désactivé
- Zones uniquement en tendance : Affiche les zones seulement lorsque la direction du filtre de tendance correspond
- Paramètres pivot A & B (gauche/droite) : Deux sensibilités (par ex., zones « grossières » + « fines »)
- Taille des étiquettes de zone : Petite/Moyenne/Grande
- Couleurs (ARGB) : Couleurs séparées pour offre/demande, testée, confirmée + ligne médiane
- Confirmation par volume + vol-MA/multiplicateur : Confirme uniquement si le volume tick est au-dessus de MA × facteur
Feu tricolore
- Afficher le feu tricolore : Activé/Désactivé
- Police + échelle 4K : Taille/lisibilité
- Mise à jour toutes les N barres : Fréquence de mise à jour (performance vs réactivité)
(Les descriptions des champs de paramètres peuvent être présentées clairement via l’attribut/descriptions Parameter ; la plateforme supporte le regroupement et les descriptions directement dans l’interface des paramètres.)
À qui cela s’adresse
- Scalpers et traders intraday qui ont besoin d’un contexte rapide : VWAP/OR pour la structure, bulles pour l’« activité », zones pour les zones de réaction
- Traders qui veulent une visualisation claire sans empiler plusieurs indicateurs
- Utilisateurs qui peuvent vouloir une vue filtrée par tendance optionnelle (EMA/ADX), tout en gardant le noyau comme affichage plug-and-play
Utilisation typique (courte & pratique)
Vérifiez le biais via VWAP + feu tricolore, et utilisez l’OR comme « zone de bataille » pendant la phase d’ouverture.
Utilisez les bulles comme indice que « quelque chose au-dessus de la moyenne se passe ici » (cassure, absorption, impulsion).
Utilisez les zones comme zones de planification : premier contact = « Testée » ; une réaction avec un volume élevé peut être marquée comme « Confirmée » ; la ligne médiane aide à un trading propre niveau à niveau.


