
Deskripsi
📊 COT Indicator History Pro — Aliran Aktor + Arah (Institusional / Hedgers / Retail)
CotIndicatorHistoryPro menghadirkan Commitments of Traders (COT) yang canggih langsung ke grafik Anda, dengan rincian jelas berdasarkan pelaku pasar (Institusional, Hedgers/Komersial, Retail).
Ini menunjukkan tidak hanya di mana setiap aktor diposisikan (didominasi long/short), tetapi juga apa yang mereka lakukan saat ini (menambah longs atau shorts), plus sebuah garis sintetis Arah untuk menyoroti bias yang berlaku.
Indikator memuat dataset-nya dari umpan JSON yang aman (HISTORY + OUTPUT) dan menyelaraskannya dengan aman pada grafik (opsi anti-lookahead menggunakan PublicationDate).
🗓️ Pembaruan Data Mingguan (Jumat 21:00)
Dataset COT diperbarui setiap Jumat pukul 21:00 (waktu Eropa/Roma) berkat pipeline otomatisasi khusus:
skrip pemrosesan canggih melakukan perhitungan dan mempublikasikan nilai yang diperbarui ke umpan JSON yang digunakan oleh indikator (dan ekosistem cBot terkait jika terpasang).
✅ Indikator itu sendiri menyegarkan di platform menggunakan pengaturan Refresh Seconds Anda dan akan menampilkan data mingguan baru segera setelah dipublikasikan.
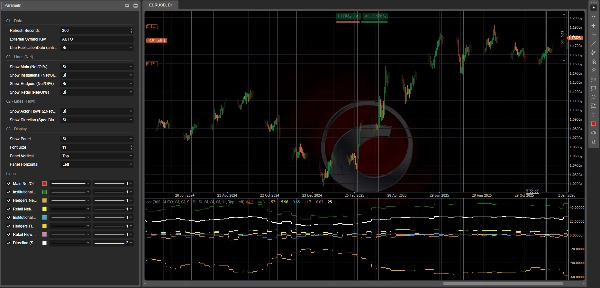
✅ Apa yang Anda Dapatkan (Garis + Panel)
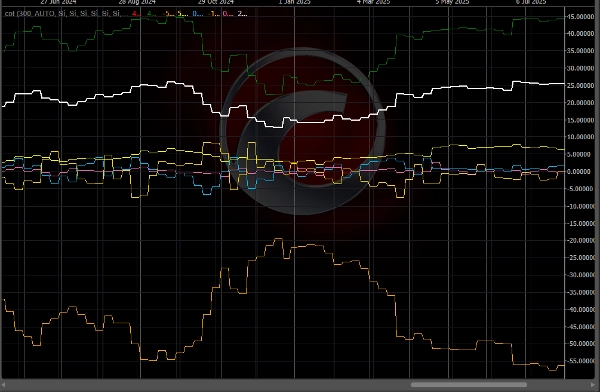
🔥 Garis “Aliran” (3 Aktor) — ΔNet/OI%
Garis-garis ini mewakili perubahan posisi Bersih dari minggu ke minggu, dinormalisasi oleh Open Interest:
- 🔵 Aliran Institusional (ΔNet/OI%)
- 🟡 Aliran Hedgers / Komersial (ΔNet/OI%)
- 💗 Aliran Retail (ΔNet/OI%)
📌 Cara membacanya:
- Di atas 0 ⇒ aktor sedang menambah LONG Bersih (menambah longs dan/atau menutup shorts)
- Di bawah 0 ⇒ aktor sedang menambah SHORT Bersih (menambah shorts dan/atau mengurangi longs)
- Nilai absolut yang lebih besar (misalnya, ±1,5%, ±3%) ⇒ perubahan posisi yang lebih kuat dan bermakna
🧭 Garis “Arah” — Bias Spekulatif Net/OI%
- ⚪ Arah (Bias Spek) Net/OI% merangkum arah “spekulatif” yang berlaku (rata-rata Institusional + Retail, dengan fallback jika diperlukan).
📌 Cara membacanya:
- > 0 ⇒ Bias Spekulatif LONG
- < 0 ⇒ Bias Spekulatif SHORT
- ≈ 0 ⇒ fase FLAT / netral
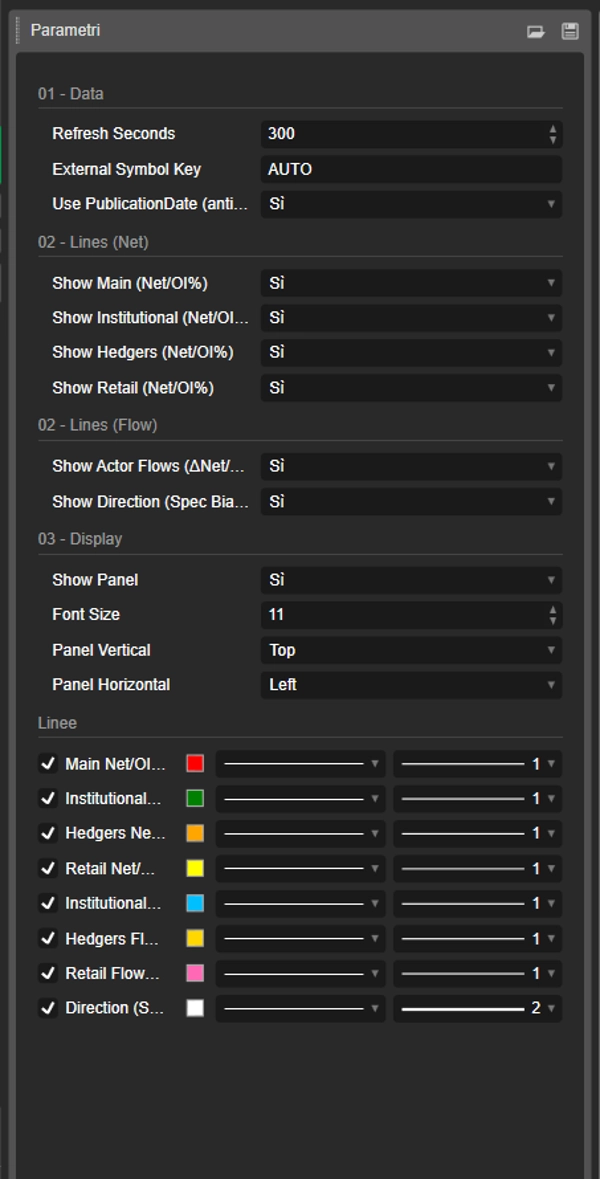
🧩 Panel Info (Konteks Lengkap)
Panel bawaan menampilkan:
- 📄 Tanggal Laporan / Tanggal Publikasi
- 📌 Open Interest + WoW (perubahan minggu ke minggu)
- 🎯 Sinyal teks (jika tersedia di OUTPUT)
- Untuk setiap aktor:
-
- Bias (didominasi LONG / SHORT / FLAT) berdasarkan Net
- Net/OI%
- Aliran (ΔNet/OI%)
- WoW ΔLong / ΔShort / ΔNet untuk memahami bagaimana posisi berubah
🧠 Cara Membacanya (Sederhana & Praktis)
✅ Aliran vs Bias (Perbedaan Utama)
- Aliran = apa yang mereka lakukan sekarang (menambah longs atau shorts)
- Bias = bagaimana posisi keseluruhan mereka (didominasi long atau short)
Contoh:
- Institusional Bias LONG + Aliran positif ⇒ mereka masih mendorong long
- Institusional Bias LONG + Aliran negatif ⇒ pengurangan long / kemungkinan rotasi
🚦 Skenario Perdagangan Tipikal
✅ Skenario A — Konfirmasi Tren
- Arah > 0
- Aliran Institusional > 0
➡️ Tekanan long konsisten: sering menjadi setup kelanjutan.
✅ Skenario B — Potensi Pembalikan (Smart Money vs Retail)
- Aliran Institusional > 0 sementara Aliran Retail < 0
➡️ Retail menjual/short sementara institusi membeli: kemungkinan akumulasi.
(Sebaliknya = kemungkinan distribusi)
✅ Skenario C — Hedgers sebagai “Peringatan”
- Hedgers pada level ekstrem (Net/OI jauh dari netral) + Aliran kuat
➡️ Zona kelebihan kemungkinan / hedging agresif (sering lebih baik sebagai peringatan daripada pemicu masuk langsung).
✅ Skenario D — Pasar “Mengisi” (Risiko Breakout)
- Aliran kuat + Open Interest WoW meningkat
➡️ Posisi baru masuk: probabilitas pergerakan lanjutan sering meningkat.
⚡ Rutinitas Membaca 10 Detik
- Periksa Arah: LONG (>0) atau SHORT (<0)
- Periksa Aliran Institusional: mengonfirmasi atau menyimpang?
- Periksa Aliran Retail: mengonfirmasi atau sebaliknya?
- Periksa Open Interest WoW: ekspansi atau pembubaran posisi?
✅ Simbol yang Didukung + Legenda Kunci (Kunci Simbol JSON)
Indikator dapat menganalisis instrumen apa pun yang tersedia di umpan JSON (field data[].symbol di OUTPUT).
Cara memilih instrumen yang benar
- Kunci Simbol Eksternal = AUTO 👉 secara otomatis menggunakan simbol grafik (dan menghapus suffix setelah “.”, misalnya
US2000.ecn→US2000). - Jika broker Anda menggunakan nama simbol berbeda 👉 atur Kunci Simbol Eksternal ke kunci JSON yang tepat (tidak sensitif huruf besar/kecil).
Kunci saat ini di umpan (contoh snapshot: reportDate 2026-02-17, publicationDate 2026-02-20)
- FX:
AUDUSD,EURUSD,GBPUSD,USDMXN - Indeks:
US100,US2000,DOW30,VIX - Komoditas/Logam/Pertanian:
BRENT,WTI,COPPER,CORN,WHEAT,XAU(Emas),XAG(Perak) - Kripto:
BTC,ETH
📌 Jika Anda tidak melihat nilai di grafik:
- verifikasi simbol grafik cocok dengan kunci JSON
- atur Kunci Simbol Eksternal secara manual (misalnya,
ETH,US2000) - periksa panel Tanggal Laporan/Publikasi untuk memastikan dataset terbaru dimuat
⚙️ Catatan
- Mendukung penyelarasan yang lebih aman dengan Gunakan PublicationDate (anti-lookahead) ✅
- Garis dan panel dapat diaktifkan/dinonaktifkan secara individual.
📌 Penafian: indikator informasional saja, bukan nasihat keuangan. Data COT mingguan dan harus dikontekstualisasikan dengan tren, level kunci, dan volatilitas.
Ringkasan
The indicator sources data from a secured JSON feed updated every Friday at 21:00 (Europe/Rome time) and aligns it on the chart using publication dates to prevent lookahead bias. Users can view flow lines for each actor, a direction line indicating overall market bias, and an info panel detailing report dates, open interest, net positions, and weekly changes.
It supports a wide range of instruments including Forex pairs (e.g., EURUSD, GBPUSD), indices (e.g., US100, DOW30), commodities (e.g., Brent, Gold), and cryptocurrencies (BTC, ETH). Symbol selection can be automatic or manually set to match feed keys.
Typical use cases include trend confirmation, spotting potential reversals by comparing smart money and retail flows, hedger activity alerts, and breakout risk assessment based on open interest changes. The indicator is informational and designed to complement other technical analysis tools.
Ulasan pelanggan
5 | 50 % | |
4 | 50 % | |
3 | 0 % | |
2 | 0 % | |
1 | 0 % |


