
Description
Qu'est-ce que LTtradingBox ?
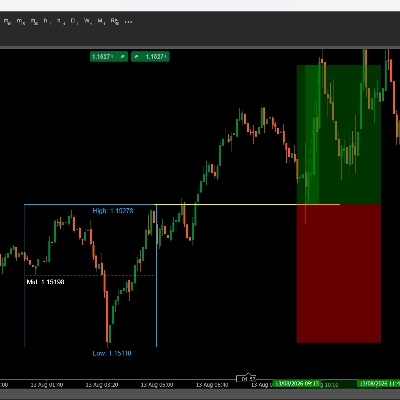
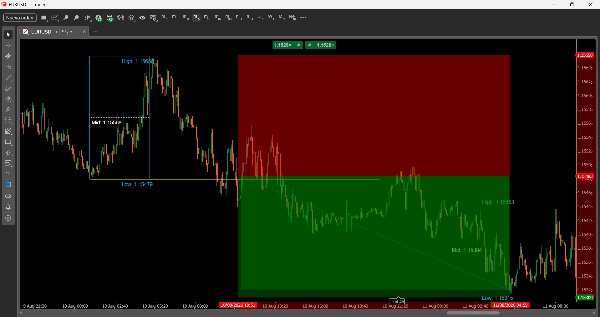
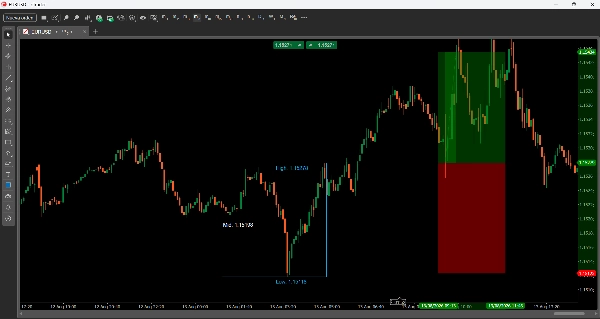
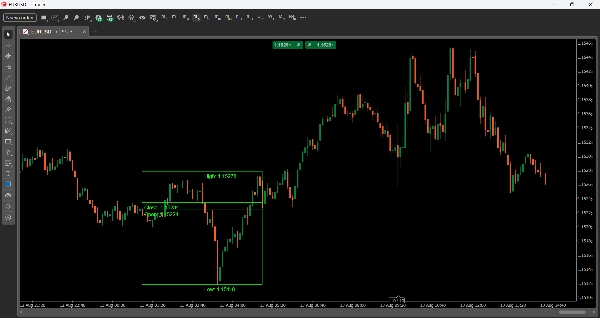
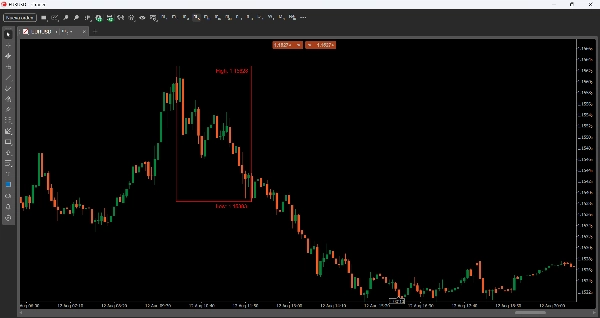
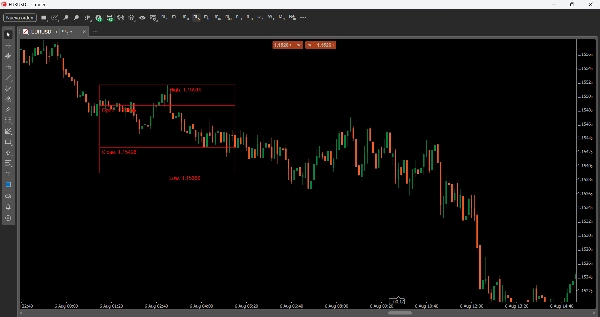
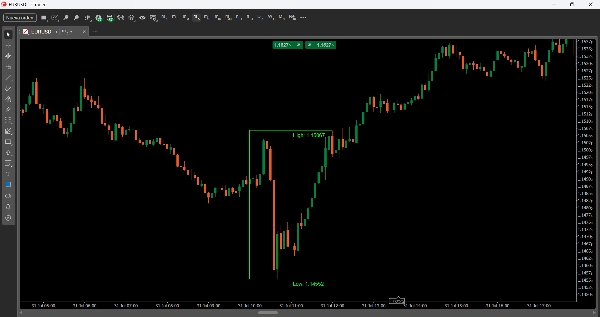
LTtradingBox marque visuellement la plage de prix (haut, bas, ouverture et clôture) d'une fenêtre temporelle que vous définissez — par exemple la session de Londres ou de New York. La boîte change automatiquement de couleur en fonction du résultat de cette session : vert si elle a clôturé à la hausse, rouge si elle a clôturé à la baisse, gris si neutre (ou les couleurs que vous choisissez pour chaque cas). Elle ajoute également des lignes de référence (Prix Moyen, Temps Moyen) et un remplissage visuel optionnel, vous aidant à repérer d'un coup d'œil les zones de liquidité, les plages d'accumulation et les niveaux clés pour trader.
Paramètres
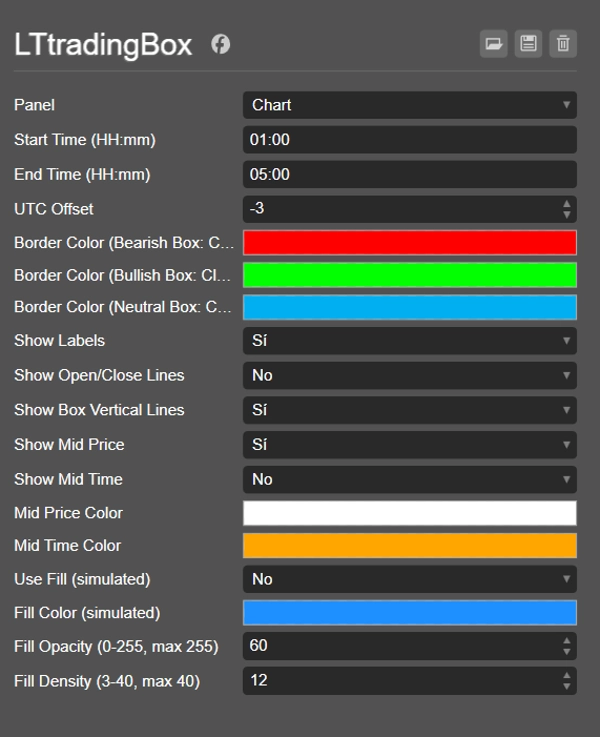
Paramètres temporels
- Heure de début (HH:mm) — Heure de début de la boîte (format 24 heures).
- Heure de fin (HH:mm) — Heure de fin de la boîte.
- Décalage UTC — Ajustement horaire pour que la boîte s'aligne avec votre heure locale ou la session que vous souhaitez suivre (par ex. Londres, NY, Asie), indépendamment du fuseau horaire de votre courtier.
Couleurs
- Couleur de la bordure (Boîte baissière : Clôture < Ouverture) — Couleur de la bordure lorsque la boîte clôture à la baisse.
- Couleur de la bordure (Boîte haussière : Clôture > Ouverture) — Couleur de la bordure lorsque la boîte clôture à la hausse.
- Couleur de la bordure (Boîte neutre : Clôture == Ouverture) — Couleur de la bordure lorsque la clôture est égale à l'ouverture.
Options d'affichage
- Afficher les étiquettes — Active ou désactive les étiquettes textuelles affichant les valeurs Haut, Bas, Ouverture et Clôture.
- Afficher les lignes d'ouverture/fermeture — Trace des lignes horizontales marquant le prix d'ouverture et de clôture à l'intérieur de la boîte.
- Afficher les lignes verticales de la boîte — Active le rectangle complet (4 bordures) ; si désactivé, seules les lignes Haut et Bas sont affichées.
- Afficher le prix moyen — Trace une ligne pointillée au point médian entre le Haut et le Bas.
- Afficher le temps moyen — Trace une ligne verticale au point médian temporel de la boîte.
- Couleur du prix moyen / Couleur du temps moyen — Couleurs personnalisables pour ces lignes.
Remplissage (remplissage visuel)
- Utiliser le remplissage (simulé) — Active un remplissage simulé à l'intérieur de la boîte (utilisant des lignes fines superposées).
- Couleur du remplissage (simulé) — Couleur du remplissage.
- Opacité du remplissage (0-255, max 255) — Niveau de transparence du remplissage.
- Densité du remplissage (3-40, max 40) — Nombre de lignes utilisées pour simuler le remplissage (densité plus élevée = remplissage plus solide).
Idées de trading
- Cassure et retest : attendez que le prix casse le Haut ou le Bas de la boîte, puis revienne retester ce niveau comme support/résistance avant d'entrer dans la direction de la cassure.
- Renversement aux extrêmes : si le prix touche le Haut ou le Bas de la boîte sans franchir avec force, cela peut signaler un rejet et un mouvement vers le côté opposé de la boîte.
- Biais directionnel par session : la couleur de la boîte vous donne un biais rapide (haussier/baissier/neutre) sur le mouvement de cette session, utile pour aligner les entrées lors des sessions suivantes.
- Prix moyen comme aimant : le point médian agit souvent comme une zone de rééquilibrage — cherchez des entrées lorsque le prix revient au milieu après un mouvement impulsif fort.
- Comparer les boîtes consécutives : puisque chaque boîte quotidienne est sauvegardée (via son tag de date), vous pouvez comparer la plage et le biais de plusieurs sessions consécutives pour repérer les tendances à court terme.
Résumé
Users can configure start and end times, apply a UTC offset to align with local or session times, and toggle display options such as labels for price points, open/close lines, full box borders, and visual fills with adjustable color, opacity, and density. The indicator supports trading strategies including breakout and retest of box boundaries, reversal signals at extremes, session-based directional bias, and using the midpoint as a rebalancing zone. It also allows comparison of consecutive session boxes to detect short-term trends. LTtradingBox is designed to assist traders in quickly identifying key levels and market structure within chosen timeframes.

















