present
Inscrivez-vous et bénéficiez d'une remise de 50 $ sur votre premier achat
Trading product for MACD Candles and Arrows - Muravha Indicateur MACD, image 1
MACD Candles and Arrows - Muravha
Indicateur
Version 1.0, Aug 2026
Windows, Mac
4.5
Avis : 2
Trading product for MACD Candles and Arrows - Muravha Indicateur MACD, image 2
Trading product for MACD Candles and Arrows - Muravha Indicateur MACD, image 3
Trading product for MACD Candles and Arrows - Muravha Indicateur MACD, image 4
Trading product for MACD Candles and Arrows - Muravha Indicateur MACD, image 5
Trading product for MACD Candles and Arrows - Muravha Indicateur MACD, image 6
4.15M
Volume tradé
39.99K
Pips gagnés
1
Ventes

Description

Chandeliers & Flèches MACD

Aperçu

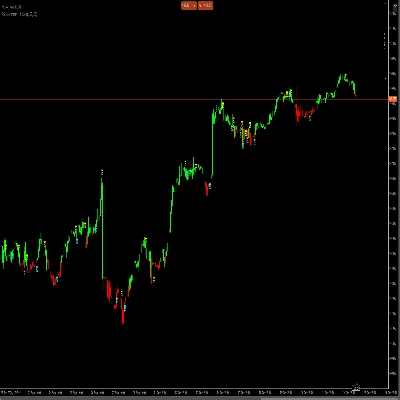
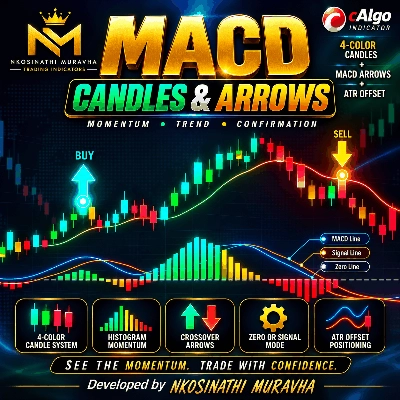
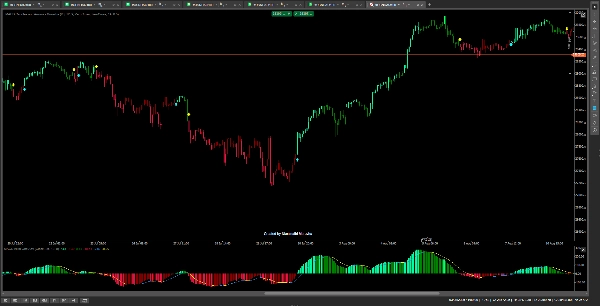
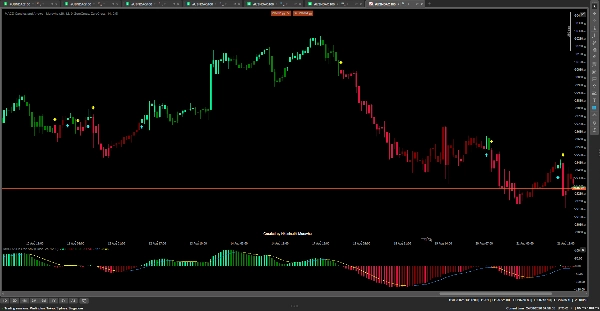
Chandeliers & Flèches MACD est un indicateur de momentum et de confirmation de tendance conçu pour aider les traders à identifier rapidement les changements de momentum haussier et baissier directement sur le graphique des prix.

Il combine l'analyse de l'histogramme MACD, les croisements de la ligne de signal MACD, la classification des chandeliers colorés et les flèches directionnelles en un seul outil visuel de trading.


Fonctionnement de l'indicateur

1. Système de chandeliers colorés

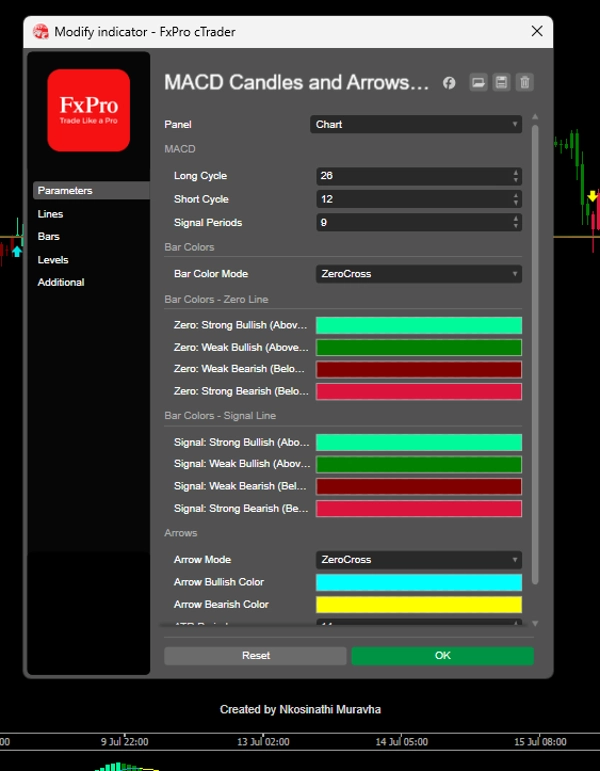
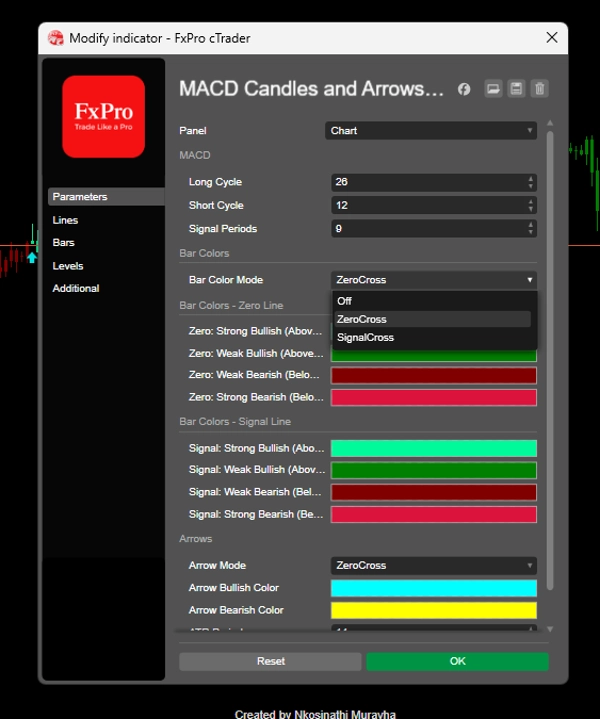
Les chandeliers sont automatiquement colorés selon le mode sélectionné.

Mode Zero-Cross évalue deux choses :

  • Si l'histogramme MACD est au-dessus ou en dessous de la ligne zéro.
  • Si le momentum de l'histogramme augmente ou diminue par rapport à la barre précédente.

Cela permet aux traders de voir non seulement la direction actuelle, mais aussi si le momentum se renforce ou s'affaiblit.

2. Mode Signal-Cross

Le mode alternatif de couleur des chandeliers compare la ligne MACD avec sa ligne de signal et mesure si la distance entre elles s'élargit ou se rétrécit.

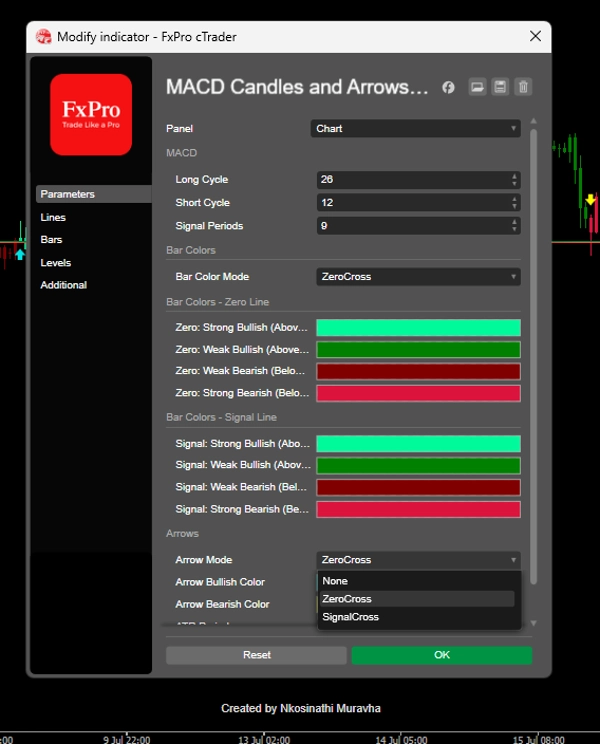
3. Flèches de trading

L'indicateur peut générer des flèches en utilisant soit les croisements de la ligne zéro ou les croisements MACD/ligne de signal.


Un trader peut l'utiliser pour :

  1. Identifier le momentum haussier et baissier.
  2. Détecter les croisements de la ligne zéro ou de la ligne de signal MACD.
  3. Reconnaître quand le momentum se renforce ou s'affaiblit.
  4. Utiliser les couleurs des chandeliers pour confirmer la direction d'un trade potentiel.
  5. Utiliser les flèches pour mettre en évidence les changements directionnels potentiels.
  6. Combiner les signaux avec l'action des prix, le support/la résistance, l'analyse de tendance ou d'autres méthodes de confirmation.


Résumé

Résumé IA
MACD Candles and Arrows - Muravha is a momentum and trend-confirmation indicator that integrates MACD histogram analysis, signal-line crossovers, color-coded candles, and directional arrows into a single visual tool on the price chart. It offers two candle-color modes: Zero-Cross Mode, which evaluates whether the MACD histogram is above or below zero and whether momentum is rising or falling; and Signal-Cross Mode, which compares the MACD line with its signal line to assess the widening or narrowing distance between them. The indicator generates arrows based on either zero-line crosses or MACD/signal-line crosses to highlight potential directional changes. Traders can use this indicator to identify bullish and bearish momentum, detect MACD crossovers, recognize momentum strength or weakness, and confirm trade direction through candle colors and arrows. It is designed to complement other analysis methods such as price action, support/resistance, and trend analysis. The product supports visualization, filtering, and signal outputs based on bar data and is categorized under momentum indicators.
Profil de l'indicateur
Catégorie de l'indicateur
Dynamique
Type de résultat
Filtre
Signaux
Visualisation
Exigences en matière de données
Barres seulement
Signaux pris en charge
Croisement
Cassure
Inversion

Discussion

Avis clients

4.5
Avis : 2
5
50 %
4
50 %
3
0 %
2
0 %
1
0 %
Avis clients
October 24, 2026
Separate modes for histogram zero crosses and MACD signal line crosses are an excellent detail, while candle colours independently show strengthening or fading momentum instead of making every colour change mean the same event as an arrow.
October 1, 2026
The colours and arrows have clearly different jobs, with candle shading tracking momentum strength and the chosen arrow mode following either histogram zero crossings or MACD signal line crosses.

Questions fréquentes

MACD
Les produits disponibles sur cTrader Store, notamment les bots de trading, les indicateurs et les plug-ins, sont fournis par des développeurs tiers et mis à disposition à titre informatif et à des fins d'accès technique uniquement. cTrader Store n'est pas un courtier et ne fournit aucun conseil en investissement, aucune recommandation personnelle ni aucune garantie quant aux performances futures.

Plus de cet auteur

Indicateur
Prop
Forex
+12
Trend Riding Indicator
Indicateur
Ichimoku
Identifies Ichimoku cloud breakouts, trend direction, and momentum to highlight potential buy and sell opportunities.

Vous pourriez aussi aimer

Indicateur
RSI
Forex
+7
Advanced S/R + liquidity zone detector with auto-configured trade styles. Generates filtered entry signals with TP/SL.
Indicateur
Key Levels
Order Block
+3
Professional indicator for automated detection and dynamic tracking of Supply & Demand zones in cTrader.
Indicateur
Order Block
Supply & Demand
+2
Professional MTF dashboard aggregating and clustering Supply & Demand zones from multiple timeframes in cTrader.
Indicateur
BTCUSD
EURUSD
+7
Pure Market Structure, Catching the Algo of Institutional move, Stay in the Game !! & know what's gonna happen Next.
Indicateur
Key Levels
Breaker Block
+5
ICT breaker blocks on 4 timeframes in one chart. Validity tracking, on-chart panel, alerts. Multi-platform bonus.
Indicateur
Prop
Forex
+5
Tick Imbalance Bars Indicator - brings institutional-grade market microstructure analysis to cTrader.
Indicateur
Prop
Forex
+12
Trend Riding Indicator
Indicateur
ATR
SMC
+5
CISD Projections with MTF panel: detects market shifts, auto targets, and clear real-time buy/sell signals.
Indicateur
Forex
Crypto
+5
Volume Imbalance Bars Indicator - brings institutional-grade market microstructure analysis to cTrader.
Indicateur
VWAP
Volume
+1
Four click-anchored VWAP lines with HTF mode, switchable line types, bands and overshoot. Fast, clean, no repaint.
Indicateur
ATR
RSI
+1
AI Supertrend MTF uses K-NN Machine Learning to eliminate lag. Features multi-timeframe projection & dynamic glowing clo
Logo de "BvsB 2026"
Les mieux notés
4.7
(4)
$100
Indicateur
Prop
Forex
+1
Smart support/resistance indicator with rejection-only Buy/Sell signals designed for H1 charts.
Indicateur
Signal
XAUUSD
The HAI Quantum V10 is an advanced indicator designed for technical analysis.
Indicateur
ATR
BOS
+5
Apex Strike: Multi-timeframe (M5-H1) non-repainting indicator with winrate dashboard & alerts (Gold, BTC).
Indicateur
ATR
SMC
+9
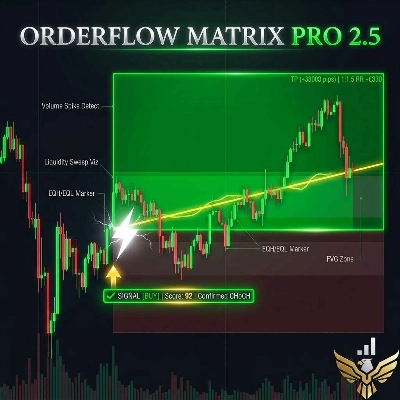
Advanced SMC/ICT Engine: MTF Structure, Liquidity Sweeps, Real-time Scoring & Pro Risk Dashboard. 100% Non-Repaint
Indicateur
AI
ATR
+27
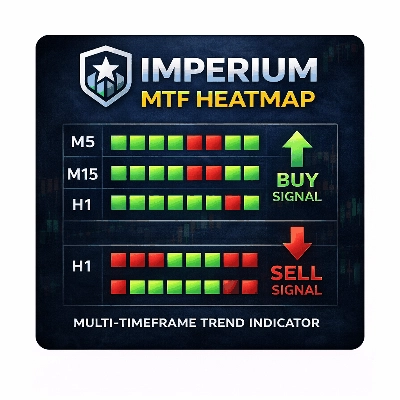
Imperium MTF Heatmap is a unique top-tier indicator for cTrader, created for traders who want more than signals
Indicateur
Prop
Forex
+15
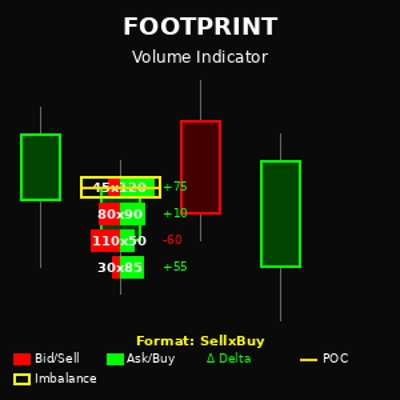
Footprint volume indicator showing bid/ask splits at each price level
Indicateur
ATR
EMA
+3
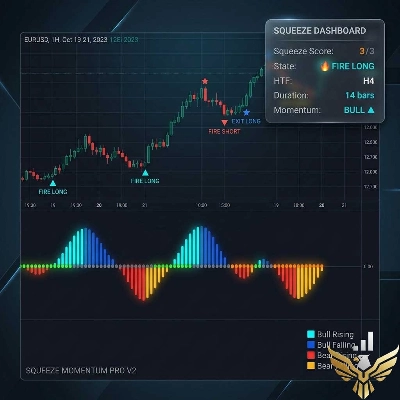
High-Tech 3-Level Squeeze Detection with HTF Filter, Carter Entry/Exit Rules, Signal Quality Grading & Real-Time

Prix

4.15M
Volume tradé
39.99K
Pips gagnés
1
Ventes