Mô tả
✔ Trang web để nhập dữ liệu, vào tab chỉ số: https://tradingeconomics.com/
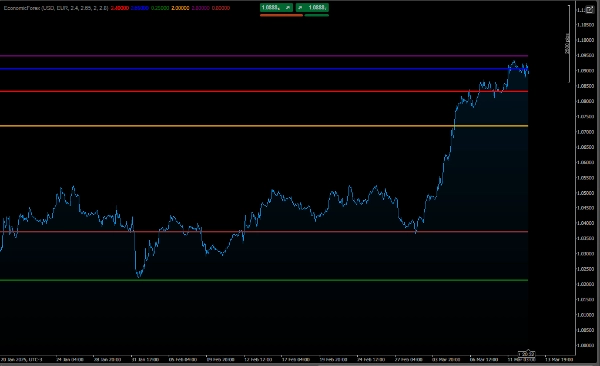
Cách Diễn Giải Biểu Đồ
Sự khác biệt giữa Lãi Suất Danh Nghĩa và Lãi Suất Thực:
Lãi suất danh nghĩa là giá trị tổng của lãi suất.
Lãi suất thực tính đến lạm phát, cho thấy sức mua thực tế của tiền.
Nếu lạm phát cao hơn lãi suất danh nghĩa, lãi suất thực sẽ âm, cho thấy mất sức mua.
So Sánh Tiền Tệ:
Biểu đồ cho phép bạn so sánh điều kiện kinh tế của hai loại tiền tệ.
Ví dụ, nếu lãi suất thực của đồng tiền chính cao hơn đồng tiền đối tác, điều này có thể cho thấy đồng tiền chính hấp dẫn hơn để đầu tư.
Diễn Biến Theo Thời Gian:
Các đường biểu diễn cách lạm phát, lãi suất danh nghĩa và lãi suất thực thay đổi theo thời gian, giúp bạn nhận biết xu hướng.
Ví Dụ Sử Dụng
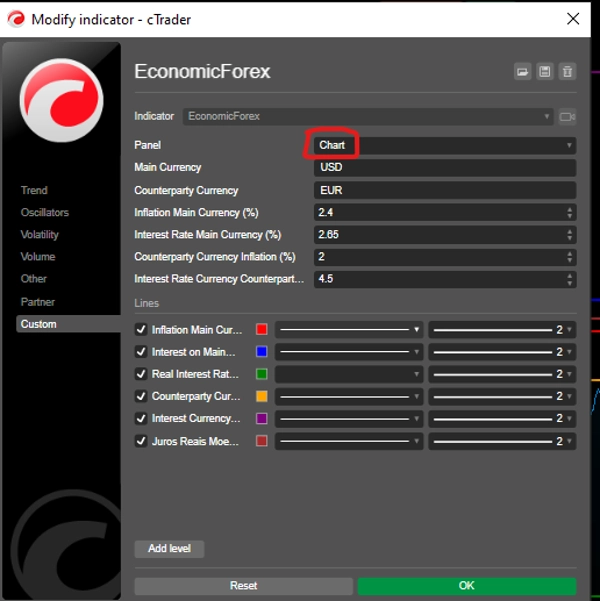
Giả sử bạn đặt các tham số như sau:
Tiền Tệ Chính: USD (Đô la Mỹ)
Lạm Phát: 5%
Lãi Suất Danh Nghĩa: 6.5%
Tiền Tệ Đối Tác: EUR (Euro)
Lạm Phát: 2%
Lãi Suất Danh Nghĩa: 4%
Biểu đồ sẽ hiển thị:
USD:
Lãi Suất Thực: 1.5% (6.5% - 5%)
EUR:
Lãi Suất Thực: 2% (4% - 2%)
Với điều này, bạn có thể so sánh điều kiện kinh tế của USD và EUR và đưa ra quyết định thông minh trên thị trường forex.
Kết Luận
Mã này là công cụ hữu ích cho các nhà giao dịch và nhà phân tích muốn theo dõi và so sánh các chỉ số kinh tế của hai loại tiền tệ trong một cặp forex. Nó cung cấp cái nhìn sâu sắc về lạm phát, lãi suất danh nghĩa và lãi suất thực, giúp hiểu rõ bối cảnh kinh tế vĩ mô và tác động của nó đối với thị trường forex.
xem thuật toán rủi ro thấp này:👇🏻
https://ctrader.com/pt/products/601?u=carneiroads
https://ctrader.com/pt/products/623?u=carneiroads
Tóm tắt
The indicator distinguishes between nominal interest rates (the gross interest rate) and real interest rates (adjusted for inflation), highlighting the purchasing power of money. It allows comparison of economic conditions between a main currency and a counterparty currency by plotting their respective inflation, nominal, and real interest rates over time. This helps identify trends and relative investment attractiveness; for example, a higher real interest rate in the main currency compared to the counterpart may indicate greater investment appeal.
Users input data such as inflation and nominal interest rates for each currency, which can be sourced from economic data websites like TradingEconomics.com. The tool supports informed decision-making in the forex market by providing a clear view of evolving economic factors affecting currency pairs.