CursorbyteAutoFib v2
Indicateur
Version 1.0, Apr 2025
Windows, Mac
Description
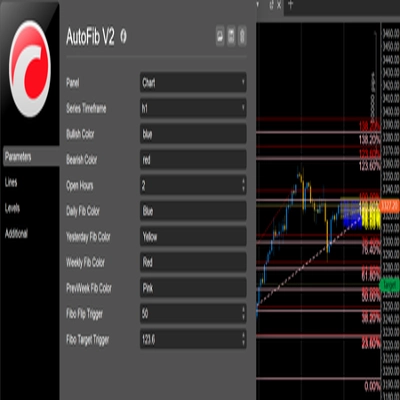
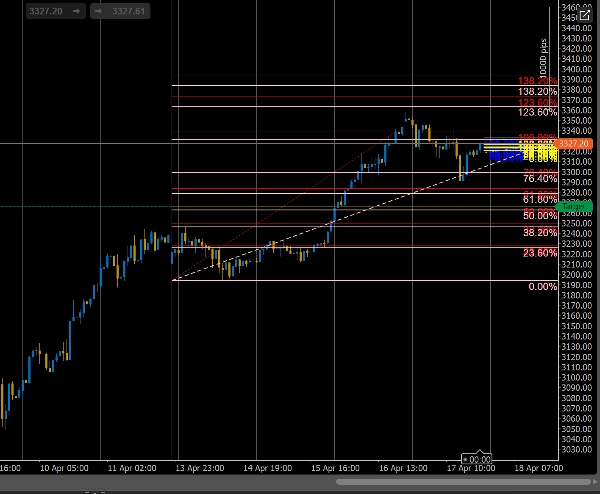
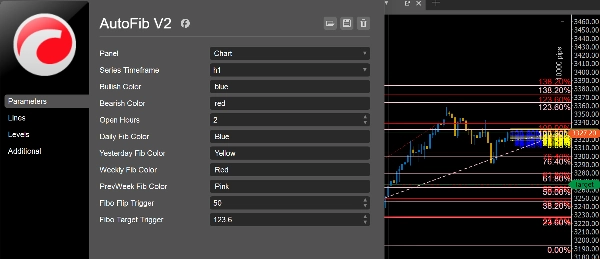
Cet indicateur cTrader trace automatiquement les niveaux de retracement et d'extension de Fibonacci basés sur les récents mouvements de prix. Il aide les traders à identifier les zones potentielles de support, de résistance et de cible, facilitant ainsi la planification précise des entrées, sorties et placements de stop-loss.
Résumé
Profil de l'indicateur
Avis clients
0.0
Avis : 0
Avis clients
Il n'y a pas encore d'avis sur ce produit. Vous l'avez déjà essayé ? Soyez le premier à en parler aux autres !
Discussion
Questions fréquentes
Les produits disponibles sur cTrader Store, notamment les bots de trading, les indicateurs et les plug-ins, sont fournis par des développeurs tiers et mis à disposition à titre informatif et à des fins d'accès technique uniquement. cTrader Store n'est pas un courtier et ne fournit aucun conseil en investissement, aucune recommandation personnelle ni aucune garantie quant aux performances futures.


![Logo de "[CB] Pivot Points Pro"](https://cdn.ctrader.com/image/webp/43463c82-67b0-4f10-a4ba-901bba091d81_32594)


![Logo de "High-Low Divergence [Iridio Capital]"](https://cdn.ctrader.com/image/webp/443c4661-7abb-40f1-842f-4b6ec560649b_40914)

Prix
Depuis le 31/10/2024
56
Ventes
1.75K
Installations gratuites