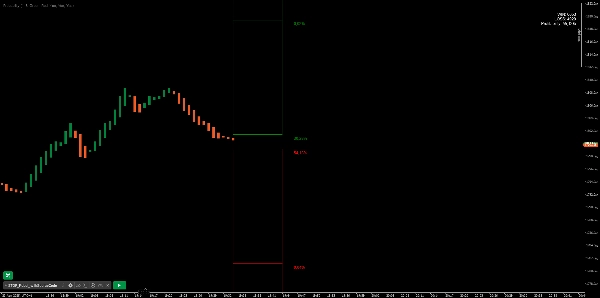
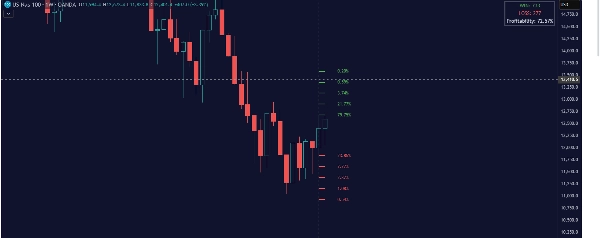
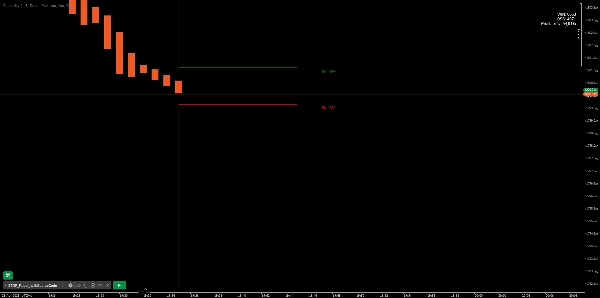
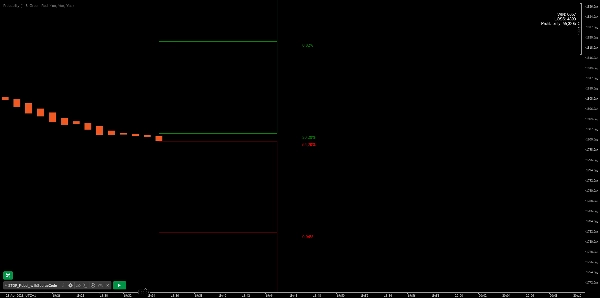
Indicateur
Breakout
BreakOut_Probability_Expo
Logo de "BreakOut_Probability_Expo"
4.0
03/09/2025
163
Desktop
Image mise en ligne de "BreakOut_Probability_Expo"Image mise en ligne de "BreakOut_Probability_Expo"Image mise en ligne de "BreakOut_Probability_Expo"Image mise en ligne de "BreakOut_Probability_Expo"

Breakout Probability is a valuable indicator that calculates the probability of a new high or low and displays it as a level with its percentage. The probability of a new high and low is backtested, and the results are shown in a table— a simple way to understand the next candle's likelihood of a new high or low. In addition, the indicator displays an additional four levels above and under the candle with the probability of hitting these levels.

The indicator helps traders to understand the likelihood of the next candle's direction, which can be used to set your trading bias.


█ Calculations

The algorithm calculates all the green and red candles separately depending on whether the previous candle was red or green and assigns scores if one or more lines were reached. The algorithm then calculates how many candles reached those levels in history and displays it as a percentage value on each line.


█ Example

In this example, the previous candlestick was green; we can see that a new high has been hit 72.82% of the time and the low only 28.29%. In this case, a new high was made.

Plus de cet auteur
Cumulative Delta Candles + VolumeProfile
Cumulative delta candles + volume profile
Support Resistance Zones
Support and Resistance.
DynamicVolumeSupplyDemand
Supply and Demand Zones
VolumeProfile_8
Scalpers Volume Profile
Tape reader
TAPE READER :-)
Insider_CumulativeDelta
Robust Cumulative delta,Atr and imbalance indicator.
MTF Candles
Multi Timeframe Candle drawing. Draw Any candles from any timeframe on your chart :-)
Indicateur
Grid
NAS100
NZDUSD
+17
Institutional Volume Supply Demand
Volume Profile Supply Demand
Indicateur
NAS100
NZDUSD
XAUUSD
+13
ORDERFLOW_SKIA_Plynuly
This Indicator will show you Direction, Distance, and Time;
Cumulative Delta_noSourceCode
Demo of my main indcator.
Vous pourriez aussi aimer
Indicateur
NAS100
NZDUSD
XAUUSD
+12
Volume Meter
Volume Meter
Indicatore livelli numeri tondi_fabio23.traders
Indicatore dei livelli numeri tondi sul grafico , regolabile.Indicator of levels round numbers on the graph, adjustable
Bar Explosion
cTrader indicator with mini-timeframe candlesticks. Customize timeframe, colors, margins. Perfect for traders.
Daily Sessions HighLow Helper
Shows daily and sessions highs / lows and session boxes, everything configurable
Golden Boom And Crash Spike Detector
Golden Boom and Crash Spike Detector is a trading tool designed for Crash 300 and Boom 300 indices on M1 Timeframe.
Indicateur
Indices
RSI
XAUUSD
+8
RSI Trend Trigger
RSI Trend Trigger 📈: Uses dual-layer RSI to spot trends & generate clear buy/sell signals.
Indicateur
RSI
MACD
Multi-Timeframe Market Levels
Unlock market insights with our Multi-Timeframe Market Levels indicator, enhancing your trading strategies effortlessly
IR Candle Open
IR Candle Open plots customizable opening price lines for daily, weekly, and monthly candles
Indicateur
RSI
MACD
SmartBot-MACD & RSI Indicator
This indicator is a combination of MACD and RSI into one. This is perfect fusion and powerful indicator ever.
Anchored VWAP Buttons
MultiTimeFrame Moving Averages
3 moving averages with different periods and different time frames.
zh-cn Variety Period time panel(multilanguage)
This indicator can be used to: change color, shape size, position, change font, increase or decrease, and other function
Indicateur
ATR
Forex
RISK V1
Automated position sizing based on risk, entry, and stop loss with ATR support and visual trade setup on charts.
trPDHLC
this indicator shows previous day high low and closed with precise manner.
Les mieux notés
Gratuit
Indicateur
RSI
Breakout
Signal
+1
ZScore
Z-Score measures price deviation from its average, helping identify extremes, trends, and trading opportunities ........
Indicateur
Bollinger
Repiptor BB Colored Width
Colored Bollinger Bands Width
Larry Williams 9.1
Larry Williams 9.1
Trend Bars Color
New Trend whit buy-sell signal