
Price Projection Swing Volume
インジケーター
324 ダウンロード数
バージョン 1.0、Feb 2026
Windows、Mac
説明
🚀価格予測スイングボリューム: 📈
https://chartshots.spotware.com/c/6980f0f0287fb
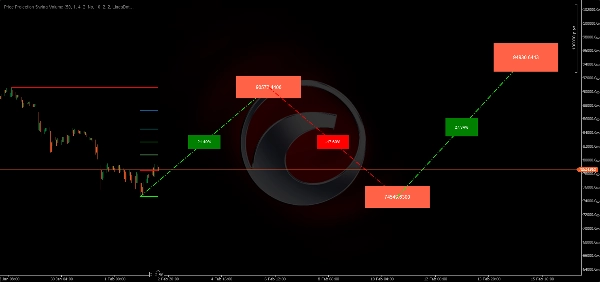
価格予測スイングボリュームは、最近の価格スイングとフィボナッチ調和比率に基づいて資産の最も可能性の高い将来の経路をマッピングするために設計された高度な予測ツールです。現在の市場範囲を特定し、潜在的な価格変動のための多段階の「ロードマップ」を投影します。
🔍 市場分析と状況
https://chartshots.spotware.com/c/6980f104dab21
このアルゴリズムは、「マーケットエンベロープ」を特定することに焦点を当てています:
- 極端なスイングポイント: 特定のルックバック期間(例:直近50バー)をスキャンして、絶対的な最高値と最低値を見つけます。
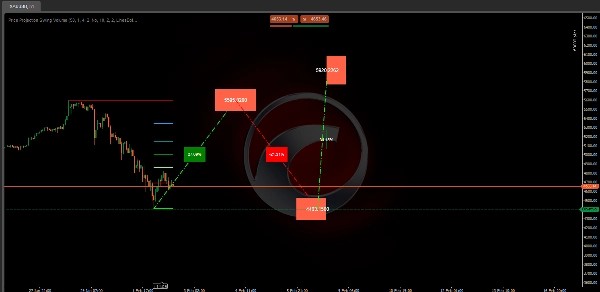
- リトレースメントゾーン: 現在のスイング内で5つの主要なフィボナッチレベル(23.6%、38.2%、50%、61.8%、78.6%)を自動的に計算しプロットして、注目すべきエリアを特定します。
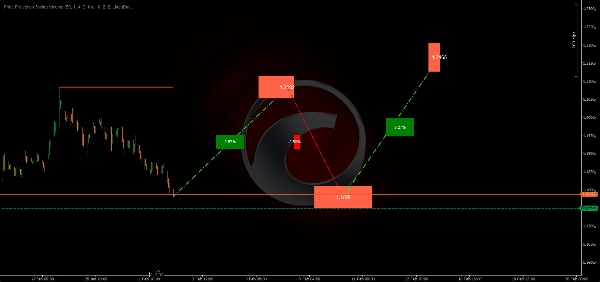
- 調和的投影: 投影比率(デフォルト0.618)を使用して、アルゴリズムは直近のスイングポイントから測定された動きに基づいて3セグメントの将来の経路を計算します。
🟢 シグナルとビジュアルの解釈方法
https://chartshots.spotware.com/c/6980f126d875a
- 水平スイングライン: 太い赤(高値)と緑(安値)の線は現在の市場の境界を表します。価格がこれらを突破すると、トレンドの変化を示すことが多いです。
- 投影パス(点線): 斜めの線は「ジグザグ」動きを予測します。これは価格が最終目標に到達するためにどのように動くかのアルゴリズムの予測です。
- パーセンテージラベル: 斜めの線上にあり、その特定の動きのセグメントに対する予想される%の利益または損失を示します。
- ターゲット価格ボックス: 各セグメントの終わりにある色付きのボックスは、アルゴリズムが目標としている正確な価格レベルを提供します。
⚙️ 主要設定とパラメータ
- ルックバック期間(50): スイングのスケールを決定します。数値が大きいほど「マクロ」スイングを探し、数値が小さいほど「マイクロ」スキャルピングスイングに焦点を当てます。
- 投影比率(0.618): この「黄金比」は予測されるジグザグの深さと高さを決定します。より攻撃的または控えめな目標に調整可能です。
- ビジュアルカスタマイズ: 強気/弱気の投影や特定のフィボナッチレベルの色を完全に調整してチャートテーマに合わせられます。
🚀 典型的な使用例とシナリオ
- ターゲット設定: 予測された価格ボックスを使用してスイングトレードの利確レベルを設定します。
- 反転の予測: 投影が上昇前の深いリトレースメントを示す場合、トレーダーは価格が「谷」の点線に達するのを待ってからエントリーできます。
- 測定された動き: 「ABCD」パターンや調和的価格変動を追うトレーダーに最適です。
👤 対象トレーダープロファイル
- スイング&トレンドトレーダー: 複数日にわたってポジションを保有し、潜在的な抵抗のロードマップが必要な方に理想的です。
- 調和トレーダー: フィボナッチ比率に依存するユーザーに最適で、計算を自動で行いたい方に向いています。
- 経験レベル: 中級者。これらは予測であり、他の確認と併用して使用するべきであることを理解している必要があります。
⚠️ 重要な制限事項と使用上の注意
- 動的更新: 新しい高値または安値がルックバックウィンドウ内で作成されると、予測とスイングレベルはリアルタイムで「シフト」します。
- 初期化: インジケーターは正確にプロットを開始する前に、最低限の履歴(ルックバック期間と同等)が必要です。
概要
AIによる概要
Price Projection Swing Volume is an advanced indicator designed for swing and trend traders to forecast potential future price movements. It analyzes recent price swings within a user-defined lookback period (default 50 bars) to identify extreme swing points—the highest highs and lowest lows—and calculates key Fibonacci retracement levels (23.6%, 38.2%, 50%, 61.8%, 78.6%) within the current market range. Using a harmonic projection ratio (default 0.618), it generates a three-segment zigzag projection path that maps likely price targets.
The indicator visually displays horizontal swing boundary lines (red for highs, green for lows), dotted diagonal projection lines with percentage gain or loss labels, and target price boxes indicating exact projected price levels. These features help traders set take profit targets, anticipate retracements or reversals, and identify measured moves consistent with harmonic patterns.
Key customizable settings include the lookback period for swing scale, projection ratio for target aggressiveness, and visual color options for bullish/bearish projections and Fibonacci levels. The indicator updates dynamically as new highs or lows form within the lookback window and requires sufficient historical data to initialize.
Price Projection Swing Volume supports multiple markets including BTCUSD, EURUSD, GBPUSD, NZDUSD, XAUUSD, NAS100, and USDJPY, making it suitable for traders using Fibonacci-based harmonic strategies and swing trading approaches.
インジケーターのプロフィール
カスタマーレビュー
0.0
レビュー: 0
カスタマーレビュー
この商品にはまだレビューがありません。お使いになったことがある方は、ぜひレビューをお願いします。
ディスカッション
よくあるご質問
BTCUSD
Fibonacci
ZigZag
Scalping
EURUSD
GBPUSD
NZDUSD
XAUUSD
NAS100
USDJPY
cTrader Storeで入手可能な取引ボット、インジケーター、プラグインなどの商品は、第三者の開発者が提供するものであり、情報と技術の取得のみを目的としてご利用いただけます。cTrader Storeはブローカーではなく、投資助言や個人的な推奨を行うことも、将来のパフォーマンスを保証することもありません。


これも好きかも


価格
登録日 03/10/2024
163
販売
39.2K
無料インストール