
Mô tả
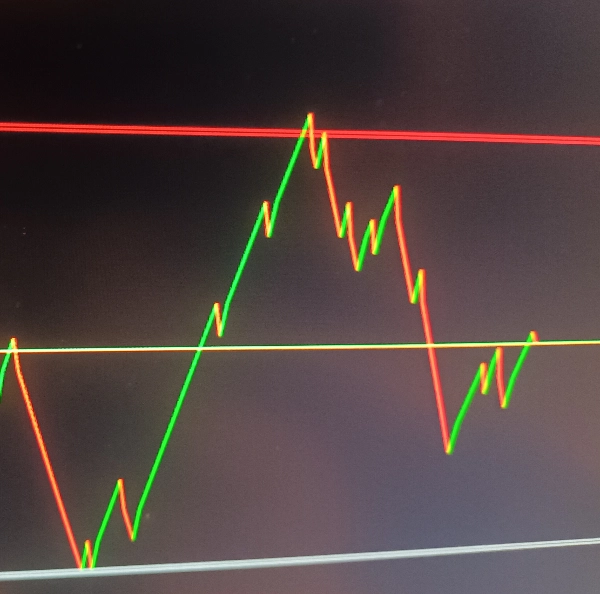
Xu hướng trực quan:
Vẽ các đường xu hướng (màu xanh lá cho xu hướng tăng, màu đỏ cho xu hướng giảm) dựa trên sự thay đổi hướng giá
Vẽ một đường giá màu vàng trên biểu đồ
Vùng Hỗ trợ/Kháng cự:
Các mức hỗ trợ và kháng cự có thể cấu hình với độ dày điều chỉnh được (tính bằng pip)
Màu sắc và độ mờ tùy chỉnh cho các vùng
Các vùng tương tác có thể được điều chỉnh thủ công trên biểu đồ
Hệ thống cảnh báo:
Cảnh báo thay đổi xu hướng (khi hướng giá thay đổi)
Cảnh báo khi chạm vùng hỗ trợ/kháng cự
Cảnh báo âm thanh tùy chỉnh cho các sự kiện khác nhau
Hỗ trợ/Kháng cự tự động:
Tùy chọn điều chỉnh tự động các mức hỗ trợ/kháng cự khi xu hướng thay đổi
Cách hoạt động
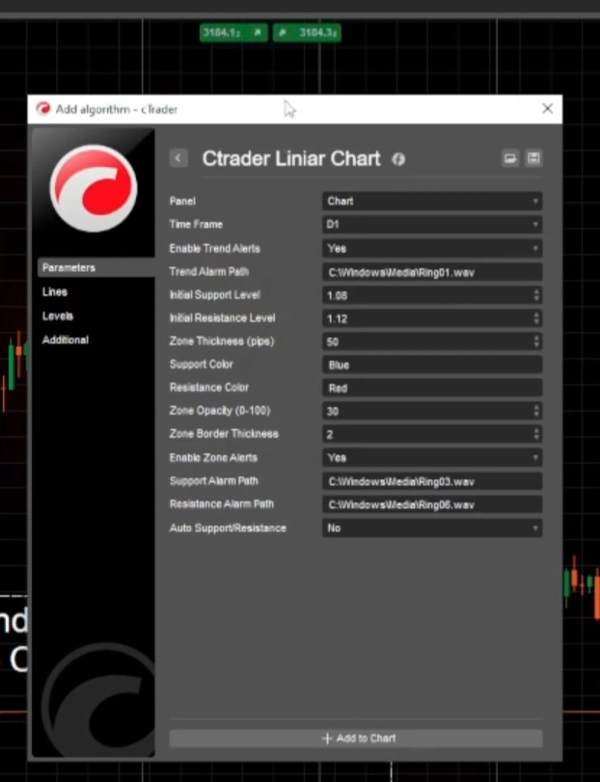
Thiết lập khung thời gian đã chọn (mặc định là Hàng ngày)
các mức hỗ trợ/kháng cự với giá trị mặc định hoặc do người dùng định nghĩa
Bắt đầu bộ đếm thời gian để kiểm tra định kỳ việc điều chỉnh vùng
Logic tính toán
Đối với mỗi thanh, so sánh giá đóng cửa hiện tại với giá đóng cửa trước đó
Xác định hướng xu hướng hiện tại (tăng/giảm)
Vẽ một đường xu hướng giữa giá hiện tại và giá trước đó
Nếu hướng xu hướng thay đổi:
Tùy chọn cập nhật tự động các mức hỗ trợ/kháng cự
Kích hoạt cảnh báo xu hướng (nếu được bật)
Kiểm tra xem giá có vào các vùng hỗ trợ/kháng cự và kích hoạt cảnh báo tương ứng
Quản lý vùng
Các vùng hỗ trợ/kháng cự được vẽ dưới dạng hình chữ nhật bán trong suốt
Các vùng có thể được điều chỉnh thủ công trên biểu đồ và chỉ báo sẽ theo dõi các thay đổi này
Độ dày vùng có thể cấu hình theo pip
Loại cảnh báo
Cảnh báo xu hướng: Kích hoạt khi giá thay đổi hướng (tăng/giảm)
Cảnh báo vùng: Kích hoạt khi giá vào các vùng hỗ trợ/kháng cự
Cảnh báo mức tự động: Khi hỗ trợ/kháng cự tự động được bật, cảnh báo khi các mức này được điều chỉnh tự động
Lựa chọn khung thời gian
Bật/tắt các loại cảnh báo khác nhau
Đường dẫn tệp âm thanh tùy chỉnh cho các cảnh báo khác nhau
Mức hỗ trợ/kháng cự.
Tóm tắt
The indicator features configurable support and resistance zones displayed as semi-transparent rectangles, with adjustable thickness in pips, customizable colors, and opacity. These zones are interactive and can be manually adjusted on the chart, with the indicator tracking any changes.
An alert system notifies users of trend changes, price entries into support/resistance zones, and automatic adjustments of these levels if the auto-support/resistance feature is enabled. Alerts can be customized with different sound files and can be enabled or disabled individually.
The indicator periodically checks for zone adjustments and updates support/resistance levels automatically when trends change, if configured. It supports time frame selection and provides a comprehensive visual and alert-based approach to monitoring price trends and critical levels in trading charts.


