Deskripsi
Sebagian besar indikator tren menjawab pertanyaan yang sama dengan cara yang sama: melicinkan harga, menggambar beberapa garis, mencari persilangan. FDQ Price Channel dibangun berdasarkan pertanyaan yang berbeda — apa sebenarnya yang dilakukan harga, yang dibersihkan dari kebisingan dan drift, dan apa yang memberi tahu Anda tentang kemana kemungkinan harganya akan bergerak?
Hasilnya adalah indikator tren berbasis saluran yang menggabungkan tiga lapisan analitis berbeda menjadi satu overlay yang dapat dibaca.
- Poin-Poin Utama
Titik Awal yang Berbeda. Seri harga yang digunakan sebagian besar indikator secara statistik merupakan masalah.
Harga mentah membawa komponen random walk yang mengaburkan struktur yang bermakna. Sebelum saluran apapun digambar, FDQ menerapkan transformasi diferensiasi fraksional — teknik yang dipinjam dari riset kuantitatif — yang menghilangkan drift ini sambil dengan sengaja mempertahankan memori jangka panjang dalam data. Yang tersisa adalah seri yang telah ditransformasi yang masih mencerminkan kemana pasar telah bergerak, tetapi tidak lagi didominasi oleh posisi saat ini. Ini adalah fondasi dari semua yang dibangun selanjutnya.
- Kebisingan Memiliki Biaya
Setiap metode pelicinan berbasis lag menukar waktu dengan akurasi. Penyaringan Kalman tidak demikian.
Filter Kalman adalah proses estimasi rekursif: ia terus memperbarui pandangannya tentang pasar, menyeimbangkan seberapa banyak mempercayai data baru dibandingkan dengan apa yang sudah ditetapkan. Berbeda dengan rata-rata bergerak, ia tidak memiliki jendela pandang tetap dan tidak memperlakukan semua bar masa lalu secara sama. Outputnya adalah representasi harga yang lebih bersih yang merespon dengan cepat terhadap pergerakan nyata dan menolak bereaksi terhadap kebisingan — tanpa sinyal tertunda yang biasanya dihasilkan oleh pelicinan.
- Band Dibangun dari Perilaku, Bukan Rumus
Band deviasi standar mengasumsikan harga terdistribusi normal. Padahal jarang terjadi.
Batas saluran FDQ didefinisikan menggunakan analisis kuantil — distribusi statistik aktual dari harga yang telah ditransformasi selama periode pandang. Band atas menandai level yang benar-benar dicapai seri pada ekstrem atas rentangnya; band bawah melakukan hal yang sama pada ekstrem bawah. Ini bukan batas teoretis yang dihitung dari rata-rata — mereka mencerminkan dimana harga sebenarnya diperdagangkan, yang membuatnya lebih responsif terhadap bagaimana pasar benar-benar berperilaku pada waktu tertentu.
- Lapisan Kedua di Dalam Saluran
Band luar mendefinisikan rentang. Band dalam mendefinisikan zona.
Satu set band kedua berada secara proporsional di antara saluran luar dan garis tengahnya. Lapisan dalam ini menciptakan zona perdagangan yang berbeda — lebih sempit dari saluran penuh, berakar pada fondasi statistik yang sama — yang berfungsi sebagai referensi bertahap untuk entri dan klasifikasi sinyal.
- Status Tren Sebelum Segalanya
Sinyal tanpa konteks hanyalah data acak.
Indikator melacak status arah saluran secara terus-menerus, menggunakan mekanisme suara mayoritas di antara tiga komponen band. Ketika setidaknya dua dari tiga bergerak ke arah yang sama, status tren dikonfirmasi sebagai Naik atau Turun. Sinyal hanya dihasilkan sesuai dengan status saat ini — setup long hanya dalam kondisi Naik, setup short hanya dalam kondisi Turun. Ketika pasar tidak memenuhi ambang ini, tidak ada status yang diumumkan dan tidak ada sinyal yang dihasilkan. Transisi antar status ditandai sebagai garis vertikal langsung di grafik.
- Tiga Setup Rebound yang Berbeda
Tidak semua pullback sama. Indikator mengenali tiga tingkatan.
Setelah status tren aktif, indikator mengamati pola rebound spesifik — momen ketika harga bergerak melawan tren, menyentuh level yang ditentukan, dan berbalik kembali melewatinya.
-
- Mid Rebound — Harga turun di bawah (atau naik di atas) garis tengah saluran dan pulih. Pullback standar dalam sebuah tren.
- Deep Rebound — Harga meluas lebih jauh, mencapai ekstrem band dalam sebelum pulih. Pullback yang lebih serius dengan pembalikan yang lebih tegas.
- Light Rebound — Harga menyentuh band dalam di sisi tren dan langsung berbalik. Yang paling dangkal dari ketiganya, terjadi paling sering.
Setiap jenis secara visual berbeda di grafik dan dapat diaktifkan atau dinonaktifkan secara independen.
- Apa yang Anda Lihat
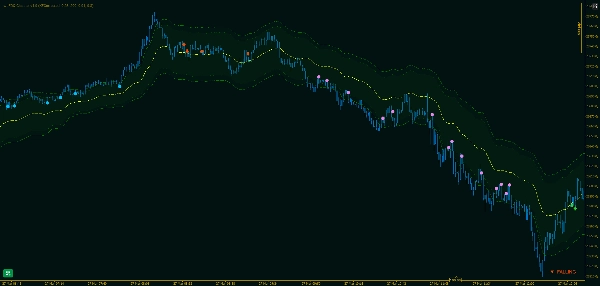
Grafik menceritakan kisah secara langsung, tanpa interpretasi.
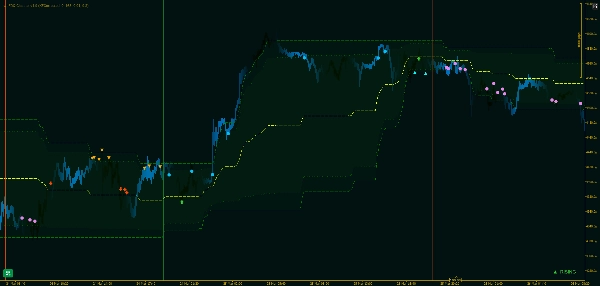
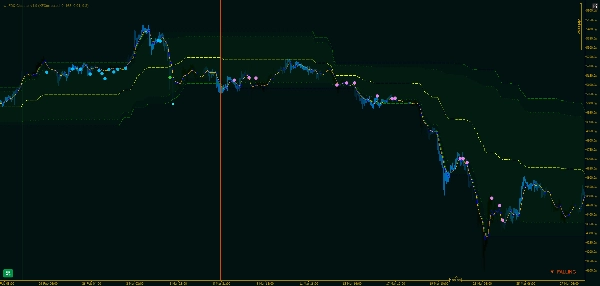
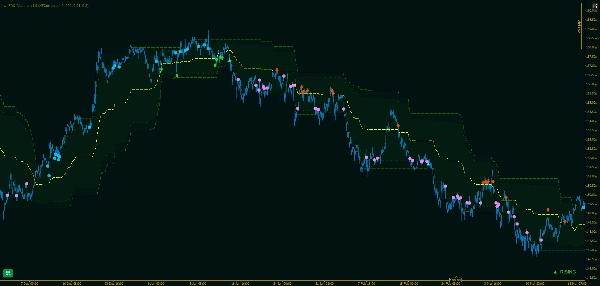
Saluran utama, band dalam, dan garis tengah menimpa harga sebagai garis kontinu. Transisi rezim ditandai dengan garis vertikal — hijau untuk Naik, merah untuk Turun — sehingga sejarah perubahan status tren terlihat sekilas. Penanda sinyal muncul pada bar dimana setiap rebound dikonfirmasi, dengan ikon terpisah untuk setiap jenis dan arah sinyal.
- Mengapa Pendekatan Ini Bertahan
Sebagian besar indikator saluran tertinggal saat pasar bergerak cepat dan bereaksi berlebihan saat tidak.
Karena saluran FDQ dibangun di atas transformasi stasioner yang mempertahankan memori daripada rata-rata bergulir, band menyesuaikan dengan distribusi perilaku aktual daripada mengejar harga. Lapisan Kalman menjaga estimasi dasar tetap bersih tanpa memperkenalkan biaya waktu yang datang dengan pelicinan berbasis jendela. Hasilnya adalah saluran yang tetap bermakna di berbagai kondisi pasar — tren, rentang, dan transisi — tanpa perlu penyesuaian manual.
Ringkasan
The channel boundaries are defined by quantile analysis of the transformed price distribution rather than standard deviation, capturing actual price extremes over the lookback period. It features outer bands marking the full range and inner bands creating a narrower trading zone for refined entry signals. The indicator continuously tracks trend direction using a majority vote across three band components, confirming Rising or Falling states and marking transitions with vertical lines on the chart.
Within active trends, wt.FDQ Channel identifies three distinct rebound setups—Light, Mid, and Deep—each representing different pullback intensities and reversal confirmations. These signals are visually distinct and configurable. The overlay displays the primary channel, inner bands, midline, trend states, and rebound signals directly on the price chart, supporting analysis across various markets including Forex, indices, and cryptocurrencies.
Ulasan pelanggan
5 | 100 % | |
4 | 0 % | |
3 | 0 % | |
2 | 0 % | |
1 | 0 % |


