
Deskripsi
Setiap tren memiliki batas atas. Exhaustion Hunter mengidentifikasi batas atas itu secara waktu nyata — dan memberi sinyal tepat saat itu retak. Dibangun di atas sistem Williams %R ganda, ia menunggu periode cepat dan lambat untuk mengonfirmasi zona ekstrem sebelum apa pun tercetak. Tidak ada tebakan, tidak ada entri awal. Hanya sinyal, ketika kondisi benar-benar terpenuhi.
Mengapa zona kelelahan mengubah segalanya
Mencapai titik ekstrem bukanlah sinyal. Meninggalkannya adalah sinyalnya. Perbedaan tunggal itu memisahkan entri yang memiliki keunggulan dari entri yang diburu. Periode lambat Exhaustion Hunter berfungsi sebagai garis dasar struktural — level di mana keyakinan arah yang berkelanjutan hidup. Periode cepat adalah pemicunya. Ketika keduanya runtuh secara bersamaan, pergerakan benar-benar kehabisan bahan bakar. Itulah jendela Anda.
Fitur
- Konfirmasi %R ganda — Periode Cepat dan Lambat harus setuju sebelum zona aktif
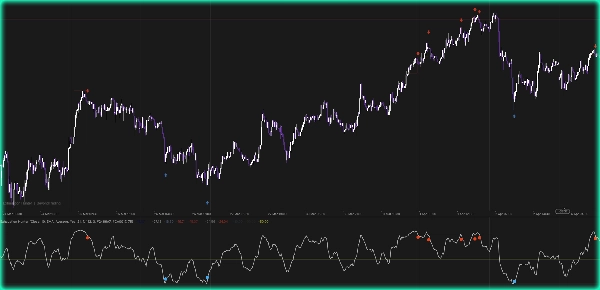
- Panah pembalikan — menyala saat zona pecah, tidak pernah sebelumnya
- Kotak grafik dinamis — zona berwarna digambar langsung pada harga selama kondisi aktif
- 4 mode perataan — SMA, EMA, WMA, RMA untuk mengatur responsivitas sinyal
- Tombol formula — konfirmasi ganda atau mode rata-rata
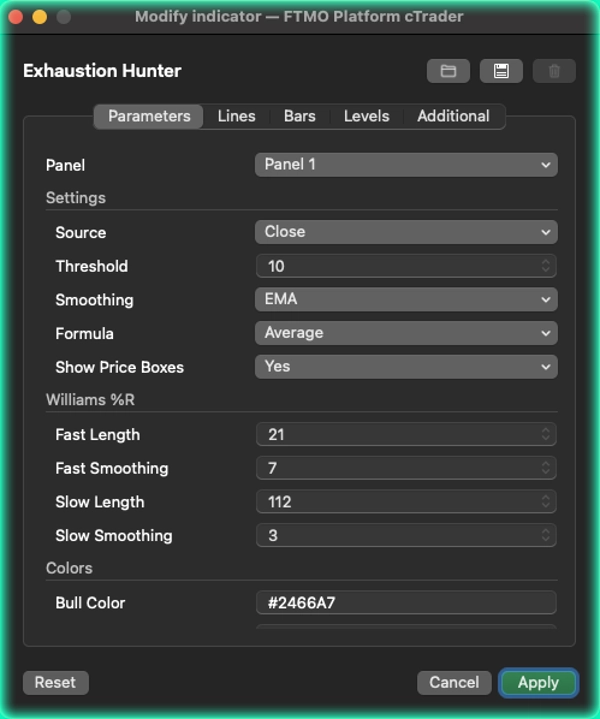
- Sepenuhnya dapat dikonfigurasi — ambang batas, warna, periode, harga sumber
Ringkasan
Key features include:
- Dual %R confirmation: Both fast and slow periods must align to activate a zone.
- Reversal arrows: Signals appear precisely when the exhaustion zone breaks.
- Dynamic chart boxes: Colored zones are drawn on the price chart during active conditions.
- Four smoothing modes: SMA, EMA, WMA, and RMA to adjust signal responsiveness.
- Formula toggle: Allows switching between dual confirmation and average mode.
- Full configurability: Users can customize thresholds, colors, periods, and source price.
Exhaustion Hunter helps traders identify when a price move has lost momentum, providing visual cues directly on the chart to assist in timing reversals. It supports customization to fit different trading styles and preferences.


![Logo "[Hamster-Coder] Pivot Points MTF"](https://cdn.ctrader.com/image/webp/4c143e5a-309c-40e3-a578-f04d1e133ffa_31159)

