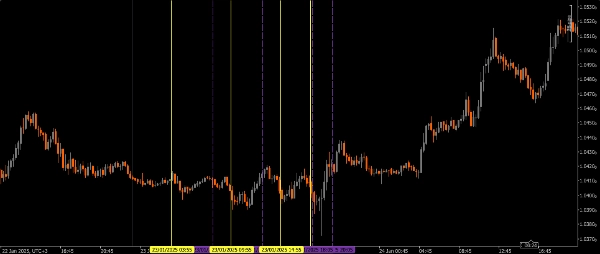
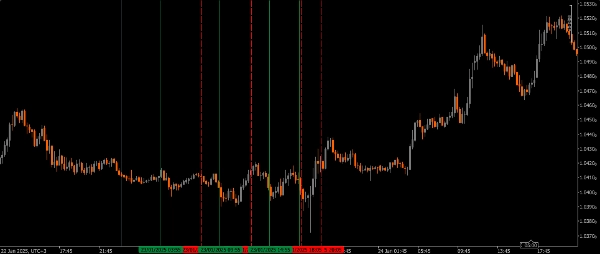
Broker & Prop
Untuk bisnis
00
Days
:
00
Hours
:
00
Minutes
:
00
Seconds
Killzone_Tidypips
Indikator
211 unduhan
Version 1.0, Jan 2025
Windows, Mac
4.0
Ulasan: 1
Sejak 19/11/2024
Penjualan
15
Instal gratis
3702
Gambar unggahan "Killzone_Tidypips"Gambar unggahan "Killzone_Tidypips"Gambar unggahan "Killzone_Tidypips"Gambar unggahan "Killzone_Tidypips"Gambar unggahan "Killzone_Tidypips"
4.0
Ulasan: 1
5
0 %
4
100 %
3
0 %
2
0 %
1
0 %
Ulasan pelanggan
August 12, 2025
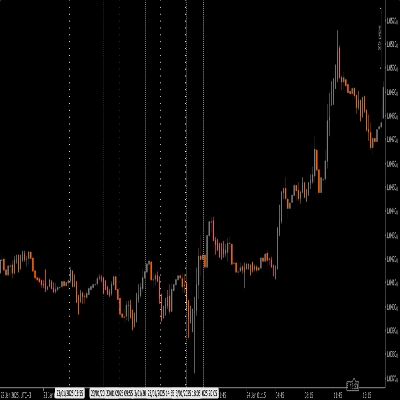
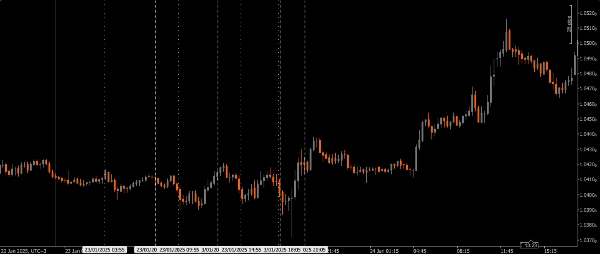
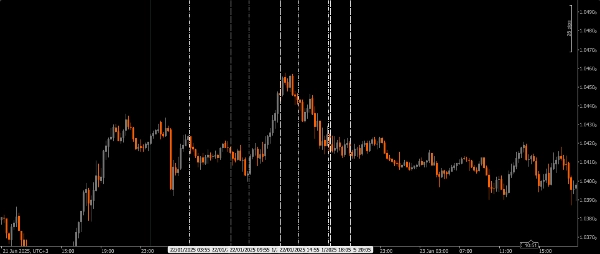
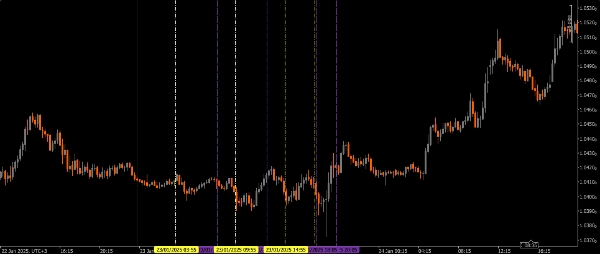
Pros: Visual session zones, customizable, great for ICT strategies. Cons: No alerts, no per-session toggle, possible chart clutter.

Produk lain dari penulis ini

ICT Killzone and Sessions high_low
This indicator is an essential tool for traders seeking to visualize key trading sessions on their charts.
Indikator
XAUUSD
Commodities
FVG_tidypips
A Fair Value Gap (FVG) indicator that identifies potential price imbalances, potential reversal and continuation zones
Previous Day Liquidity Zones (PDH - PDL)
Useful indicator for traders who want to visualize key price levels based on previous daily highs and lows.
Daily Open Pivot Level
This indicator is a valuable tool for traders looking to identify significant opening price level of any asset.
Moving Average channel
This indicator is designed to display customizable moving averages (MAs) on a chart.
Weekly Expansion (Premium_Discount Pivots)
Very handy tool for traders looking to visualize previous days premium and discount price levels.
Drawing Utility
A rectangular box with 5 adjustable Fibonacci level or even custom ones.
Indikator
XAUUSD
Commodities
True Open Pivot Levels
This indicatorFull Description: Th shows the open price lines at key market times based on Eastern Standard Time (EST).
Previous Day Equilibrium (Premium & Discount)
Plots the equilibrium price levels based on previous daily highs and lows.

Anda mungkin juga suka

Indikator
Grid
Breakout
Martingale
+4
Coloring Trendline with arrows
Coloring trendline/ Colored Trendline / Color Trendline
Indikator
NAS100
NZDUSD
XAUUSD
+10
Elliott Wave2 with Markov 5-State Confidence
Elliott Wave 2 indicator with Markov probability analysis and a confidence score to assess Wave 3 continuation quality.
VWAP - London Open
VWAP Set to London Open
Indikator
Breakout
Institutional Flow Radar
Institutional Flow Radar scans the chart for abnormal volume events and classifies them into two groups: Capital &Public
Indikator
Grid
NAS100
NZDUSD
+6
Volume Break Structure
🎯Identify zones of HIGH INSTITUTIONAL INTEREST: Where there is MORE VOLUME in the breaks, there is GREATER PARTICIPAT..
Indikator
Forex
EURUSD
SMC
AsiaSession
Visualize Asia session range with customizable lines for high, low, mid, start, and end.
Indikator
Indices
Forex
USDJPY
JPYX w HMA
JPYX Indicator with HMA
Indikator
Grid
NAS100
NZDUSD
+15
RangeBoxFibonacci
With this Fibonacci retracement indicator, traders have full control over the retracement levels displayed on the chart.
Indikator
Indices
RSI
Stocks
+3
Advanced RSI Indicator
Advanced RSI Indicator with multi-MA smoothing, Bollinger Bands, divergence detection, and fill zones for cTrader.
Indikator
NAS100
NZDUSD
XAUUSD
+13
AO_ZeroCross
Awesome Oscillator with instant zero-line cross alerts. Includes chart popup + sound notification
Indikator
Indices
Prop
Stocks
+6
New Way Sar - Pro
The Parabolic SAR, or "Stop and Reverse," is a dynamic technical analysis tool.
Renko Line Chart
Smart Signal Reversal Trend + Patterns