
Açıklama
Pinescritlabs
Ctrader Store göstergeleri: 🤖Pinescritlabs Ctrader Store cBotları:
Adil Değer Boşluğu Oturumları Altın & BTC Kırılma Oturumu Pivotları
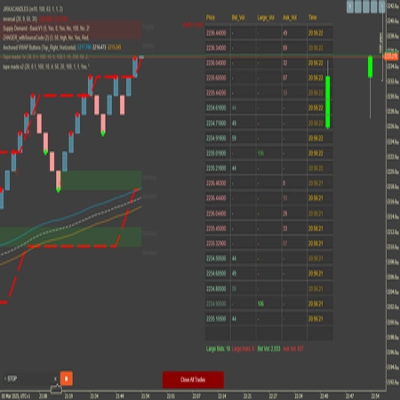
Dinamik Piyasa Yapısı
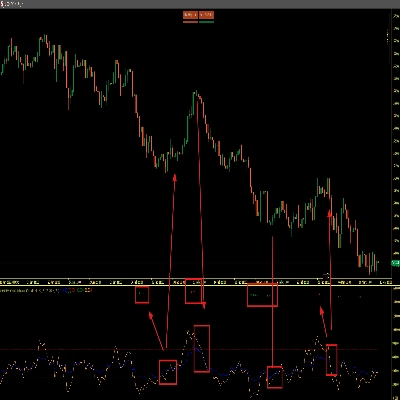
Dönüş Noktalarının Analizi
Fibonacci Lineer
Regresyon Çoklu Zaman Dilimi
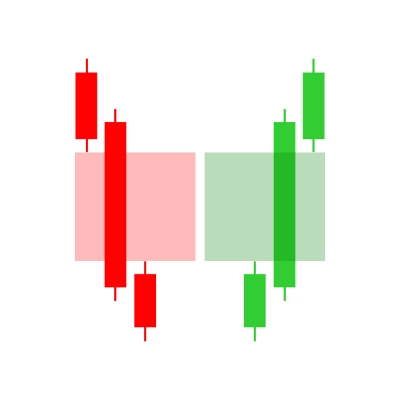
Çok Katmanlı Mum Eğilimi
İzleyici
Otomatik Destek ve
Direnç Trend Çizgileri
Tüm Destek ve
Direnç Seviyeleri
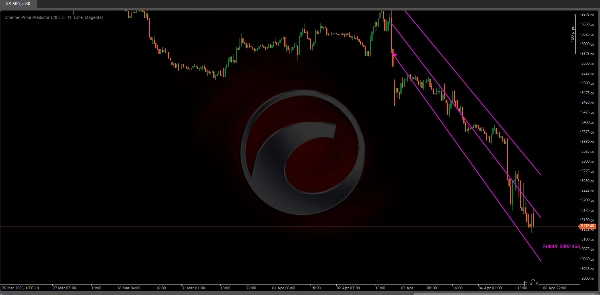
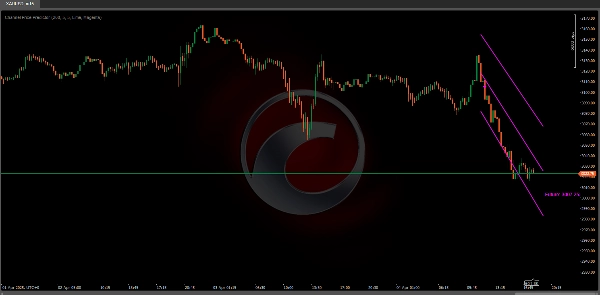
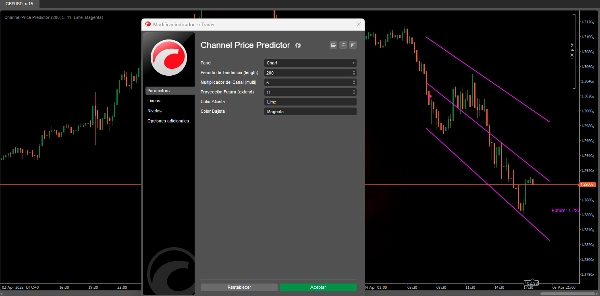
Kanal Fiyat Tahmincisi, grafikte bir trend kanalı (ya boğa ya da ayı) tanımlar ve çizer, geleceğe doğru uzatarak olası fiyat bölgelerini tahmin eder. 📈🔮
Kanal, piyasa volatilitesini ölçen ATR (Ortalama Gerçek Aralık)'ya dayanır. Son volatilite ne kadar yüksekse, kanal o kadar geniş olur ve olası hareket aralığını görselleştirmeye yardımcı olur. 📊💥
Pivot yüksekleri ve düşüklerine göre kanalları otomatik olarak tanımlar ve çizer.
Kanal çizgilerini uzatma ve gelecekteki fiyatlarını projelendirme seçeneği. 🕒📉
Bu kanal sadece mevcut hareketi göstermekle kalmaz, aynı zamanda olası fiyat değerini gösteren bir etiketle (“Gelecek: …”) geleceğe yönelik tahmini fiyat projeksiyonu sunar. 📅💡
Ne işe yarar?
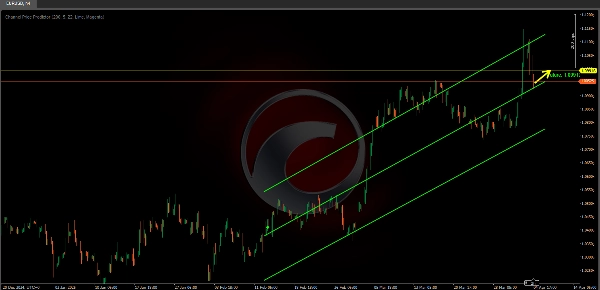
Trend Tanımlama:
Gösterge, piyasanın boğadan ayıya (veya tam tersi) geçtiğini algılamak için dahili bir mantık kullanır. Böylece varlığın yükselen ya da düşen aşamada olup olmadığını daha net görebilirsiniz. 📈🔄📉
Volatilite Kanalları:
Kanal, volatiliteyi ölçen ATR (Ortalama Gerçek Aralık)'ya dayanır. Son volatilite ne kadar yüksekse, kanal o kadar geniş olur. Bu, olası hareket aralığını görmenize yardımcı olur. 📊🔍
Gelecek Projeksiyonu:
Gösterge sadece mevcut trendi göstermekle kalmaz, kanalı birkaç dönem ileriye (ayar yapılabilir) uzatır, böylece o trend içindeki olası destek/direnç bölgelerini önceden görebilirsiniz. ⏳🚀
Kanal çizgilerini uzatma ve gelecekteki fiyatlarını projelendirme imkanı sunar. ⬆️⬇️
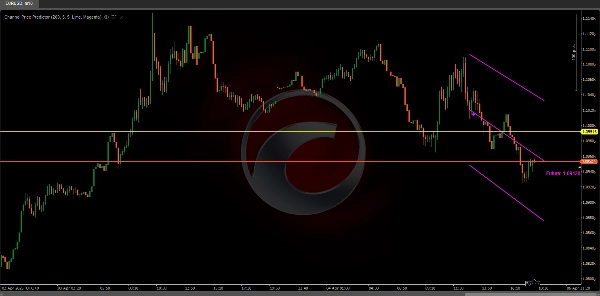
Fiyat Referansları:
Orta çizgiyi ve üst ile alt kenarları çizerek, durdurma noktalarınızı, hedeflerinizi veya hatta giriş/çıkışlarınızı volatilite hakkında daha fazla bilgi ile yönetmeniz için referanslar sağlar. 🎯📍
cTrader kısıtlamaları nedeniyle, kanalın gelecekteki uzantılarını düzgün görüntülemek için grafikte sağa kaydırmak şu anda mümkün değildir.
Görüntüleme sorunlarını önlemek için “Gelecek Projeksiyonu” parametresinin 25 dönemden az bir değere ayarlanması önerilir.
cTrader grafik uzatma özelliğini uyguladığında, bu işlevselliği tam olarak kullanmak için algoritmada geliştirmeler yapacağız.
Özet
Key features include automatic detection of trend direction changes, visualization of current trend channels, and the ability to extend channel lines into the future. This future projection helps anticipate potential support and resistance zones by displaying estimated price values labeled as “Future: …”. The indicator draws a central line along with upper and lower channel boundaries, providing reference points for placing stops, targets, and managing trade entries and exits with volatility context.
Users can configure the number of periods for future projection, with a recommended maximum of 25 periods to avoid display issues due to cTrader platform limitations. The indicator supports analysis of various markets including cryptocurrencies (e.g., BTCUSD), commodities (e.g., XAUUSD), and others where volatility and trend identification are relevant.
Müşteri değerlendirmeleri
5 | 100 % | |
4 | 0 % | |
3 | 0 % | |
2 | 0 % | |
1 | 0 % |


!["High-Low Divergence [Iridio Capital]" logosu](https://cdn.ctrader.com/image/webp/443c4661-7abb-40f1-842f-4b6ec560649b_40914)


