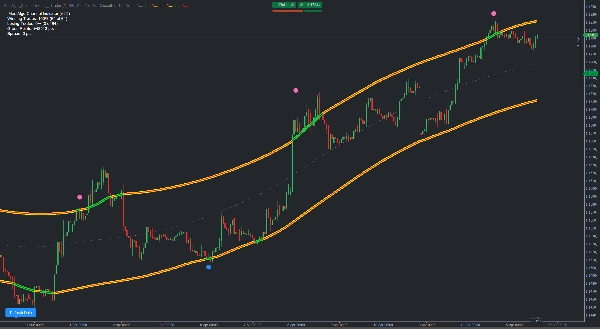
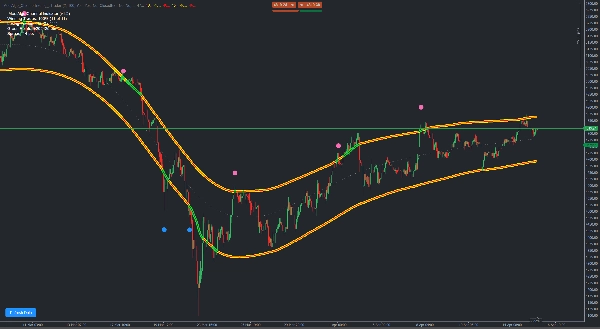
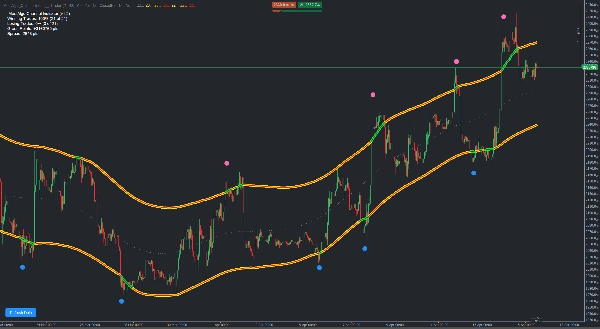
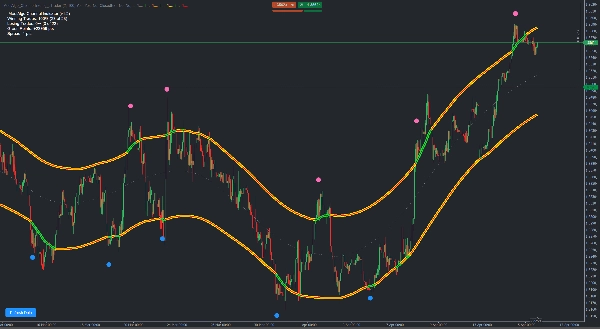
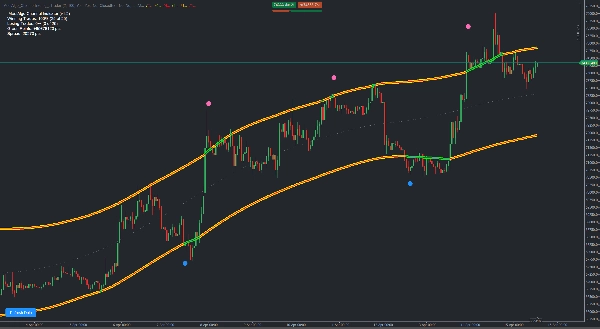
Broker e prop firm
Per le aziende
00
Days
:
00
Hours
:
00
Minutes
:
00
Seconds
MeetAlgo_ChannelTrading_cTrader
5.0
03/09/2025
235
Desktop
Da 27/12/2024
Installazioni gratuite
235
Immagine caricata di "MeetAlgo_ChannelTrading_cTrader"Immagine caricata di "MeetAlgo_ChannelTrading_cTrader"Immagine caricata di "MeetAlgo_ChannelTrading_cTrader"Immagine caricata di "MeetAlgo_ChannelTrading_cTrader"

MeetAlgo Channel Trading is a volatility-based indicator built using envelope theory. The indicator plots dynamic upper and lower bands based on recent price movement and statistical deviation. These bands aim to represent expected price boundaries, and values plotted outside the range may signal a shift in volatility.

The channel is designed to reflect general market behavior by identifying price areas that are relatively high or low. When price approaches or exceeds the upper or lower bands, a directional arrow is plotted to suggest potential reversal zones. These signals can be interpreted in combination with other forms of analysis.

The band width adapts to changing volatility, providing flexibility during different market conditions. The core method reduces lag by using a custom smoothing formula based on average price range.


Parameters Configurations

  • Deviations: Adjusts the sensitivity of the bands to volatility.
  • Minimum Bar Redraw: Sets the number of bars required before recalculating the channel.
  • Show Analysis Report: Displays historical signal-based outcome statistics.

Notifications

  • Signal Bar: Select whether calculations are based on live or closed bars.
  • Pop-Up Alerts: Displays message alerts on the platform.
  • Email Alerts: Sends email messages (requires setup in the platform).
  • Push Alerts: Sends mobile alerts (requires platform configuration).
  • Sound Alerts: Plays audio alerts from the cTrader Sounds folder.
  • Sound File Names: Names of sound files to use for directional signals.


5.0
Recensioni: 1
5
100 %
4
0 %
3
0 %
2
0 %
1
0 %
Recensioni dei clienti
July 22, 2025
Potrebbe interessarti anche
Indicatore
Indices
Prop
Stocks
+3
Smooth Heiken Ashi
The Smooth Heiken Ashi indicator is a refined charting tool designed to filter out market noise and highlight true price
Indicatore
Stocks
ATR
Forex
+1
TwoSMA PRO
TwoSMA indicator detects trend via SMA crossover, filters flat markets with ATR, and provides clear BUY and SELL signals
Indicatore
NAS100
NZDUSD
Martingale
+26
Square Matrix Trading System
Square Matrix Trading System by LudwigICT – Institutional-Grade Trading Clarity in cTrader
Indicatore
Indices
XAUUSD
Commodities
+5
Auto Signal Buy-Sell
Auto Signal BUY SELL is a professional decision-making tool designed to help you follow the trend and capture high-proba
VWAP - London Open
VWAP Set to London Open
Indicatore
Bollinger
Repiptor BB Colored Width
Colored Bollinger Bands Width
Clarosti
Clarosti a chave para decisões inteligentes no mercado
Tradingview Economic Calendar onn Chart
Customizable window inside your platform, access to any website Calendar
Indicatore
Grid
NAS100
RSI
+18
QX SessionBox ORB
QX SessionBox ORB: Session boxes + ORB levels + clean dashboard with optional closed-candle breakout signals.
IR Coral
Coral indicator
Indicatore
Indices
Prop
Stocks
+3
Market Sessions Advanced
Advanced Market Sessions with ICT killzones
Indicatore
NAS100
NZDUSD
Martingale
+26
True Deviation System
True Deviation System – Precision Meets Professional Trading
Indicatore
NAS100
NZDUSD
XAUUSD
+15
Multi Time Frame Candles FVG Liqudity smc
Multi-Time Frame Candlesticks FVG with BSL/SSL Premium Suite
MAMA CANDLES
This code implements the MESA Adaptive Moving Average (MAMA) indicator, it creates candles based on MAMA calculations.
Indicatore
Stocks
Commodities
Forex
buy sell
SmartSignal Pro: Precise BUY/SELL signals to profit in any market. Trade like a pro! 🚀
Indicatore
NAS100
Indices
NZDUSD
+9
VMM PositionPivotPro Trial
Professional position management! Calculate real-time pivots, monitor P&L & costs, and strengthen your strategy.
Indicatore
RSI
Breakout
XAUUSD
+5
Zones Supply Demand
📊Zones Supply & Demand: Identifies key price levels with high volume concentration, marking Supply/Demand Zones & Marke
Daily SD Levels - Indicator
Plots intraday VWAP and dynamic ±1/±2 standard deviation (SD) bands based on current day’s price and volume.