Descrizione
Indicator del Pinescriptlabs Store: cBot del Pinescriptlabs Store : (cBot) Gold & BTC BreakoutSession Pivots(nuovo)
Trailing Smart Algorithm (Nuovo)
Mappa di Liquidazione della Leva
Previsione Basata su Linreg & ATR
SmartTrend Supporto &
Resistenza
Linee
Sistema di Breakout del Canale
Analisi
Dinamica
della Struttura di Mercato
dei
Punti
di Svolta
Regressione
Lineare
Fibonacci
Multi-timeframe
Proiezione del Flusso di Mercato
Gradiente di Tendenza Dinamico
Tracker
Multi-Livello
Bias delle Candele
Supporto
e Resistenza
Trend
Linee
Tutti
i Supporti e
le Resistenze
Livelli
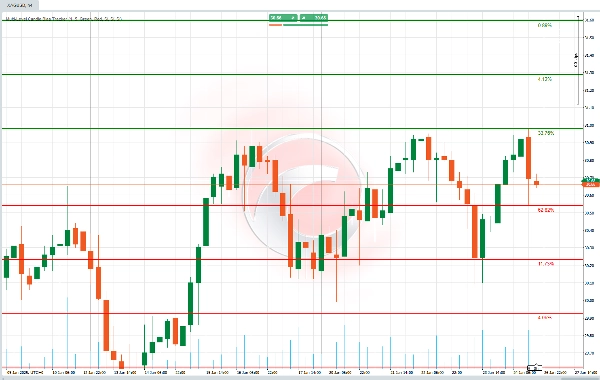
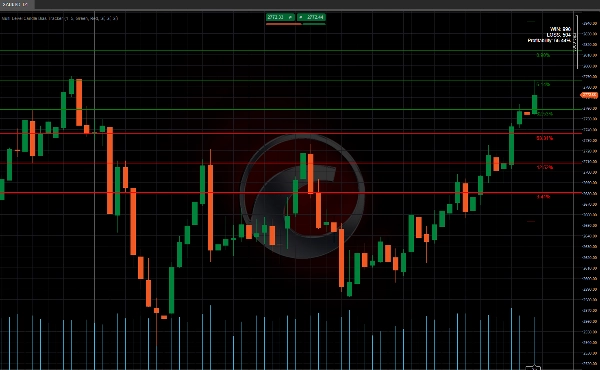
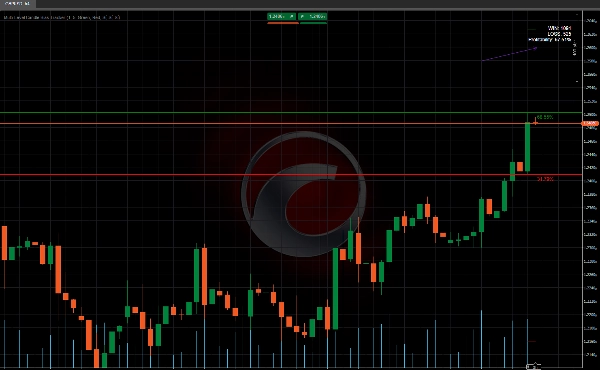
Questo algoritmo determina la probabilità che il prezzo raggiunga un nuovo massimo o minimo e lo rappresenta come un livello sul grafico, accompagnato dalla sua percentuale corrispondente. Questo calcolo è testato retrospettivamente, e i risultati sono mostrati in una tabella, rendendo facile comprendere la probabilità che la prossima candela stabilisca un nuovo massimo o minimo. 📈📉
Come funziona? 🛠️
- Probabilità di Nuovi Massimi e Minimi 🎯
-
- L'algoritmo analizza il comportamento passato del prezzo per calcolare la probabilità che il prezzo faccia un nuovo massimo o minimo nella prossima candela.
- Per esempio, se la probabilità di un nuovo massimo è del 70%, è più probabile che il prezzo salga. ⬆️
- Livelli con Percentuali 📏
-
- Disegna linee orizzontali sul grafico che rappresentano livelli chiave, insieme a una percentuale che indica la probabilità che il prezzo raggiunga quel livello.
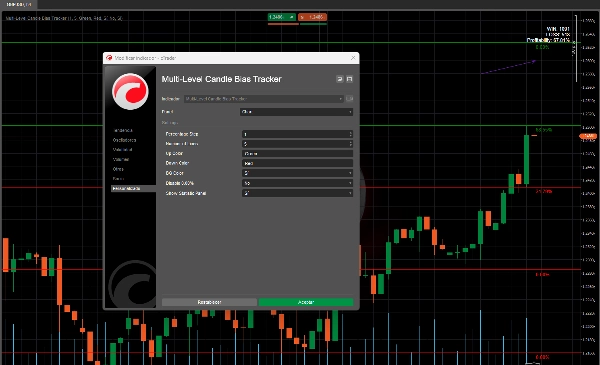
- Questi livelli sono calcolati usando una percentuale che definisci (es. 1%).
- Pannello Statistiche 📊
-
- Mostra quante volte il prezzo ha raggiunto quei livelli (successi) e quante volte no.
- Fornisce anche una percentuale di efficacia, indicandoti se quei livelli sono stati affidabili in passato. ✅❌
A cosa serve?
- Capire la direzione del prezzo: Ti aiuta a sapere se il prezzo è più probabile che salga o scenda nella prossima candela. ⬆️⬇️
- Gestire il rischio: Se un livello ha una bassa probabilità, puoi evitarlo per ridurre decisioni rischiose.
Come lo useresti?
- Osserva i livelli: Guarda le linee che l'algoritmo disegna sul grafico. 👀
- Controlla le probabilità: Se un livello ha una probabilità alta (es. 70%), è più probabile che il prezzo lo raggiunga. 📈
- Usa il pannello delle statistiche: Verifica se quei livelli hanno funzionato bene in passato per decidere se fidarti di essi. 📊
Riepilogo
The indicator includes a statistics panel that shows how many times the price has successfully reached these levels versus how many times it has not, along with an effectiveness percentage reflecting the reliability of these levels based on historical data.
This tool is designed to help traders understand the likely direction of price movement in the next candle and manage risk by avoiding levels with low probabilities. Users apply it by observing the drawn levels, checking their associated probabilities, and reviewing the statistics panel to assess the historical performance of these signals.
Supported markets include commodities, cryptocurrencies (e.g., BTCUSD), and other symbols. The indicator integrates probability-based analysis into price action trading to assist in decision-making regarding potential breakout or trend continuation scenarios.
Recensioni dei clienti
5 | 100 % | |
4 | 0 % | |
3 | 0 % | |
2 | 0 % | |
1 | 0 % |