
Beschreibung
Pinescriptlabs Store Indikatoren: 🤖Pinescriptlabs Store cBots : (cBot)
PRICE ACTION (Neu)
Gold & BTC AusbruchSitzungspivots(neu)
Trailing Smart Algorithmus(Neu)
SmartTrend Unterstützung &
Widerstand
Linien
Dynamische
Marktstruktur
Analyse
von
Wendepunkten
Fibonacci
Lineare
Regression
Multi-Zeitrahmen
Mehrstufiger
Kerzen-Bias
Tracker
Reaktive Gleitender Durchschnitt
Auto
Unterstützung und
Widerstand
Trend
Linien
Alle
Unterstützungs- und
Widerstandsniveaus
Levels
Zig Zag Unterstützung & Widerstand mit Schwüngen
1. Was macht dieser Indikator? ❓
🔍 Erkennt Preisschwünge (Hochs & Tiefs)
- Scannt aktuelle Balken ("Analyse-Tiefe") um den höchsten/niedrigsten Preis in diesem Bereich zu finden.
- Validiert Schwünge mit einem % Schwellenwert (z.B. 1%+ Änderung gegenüber dem letzten Schwung) → Markiert neue ✅ Swing Highs/Tiefs.
- Reduziert Rauschen ⚡: Bestätigt Schwünge nur, wenn die Hälfte des Analysezeitraums vergeht ohne ein höheres Hoch/tieferes Tief.
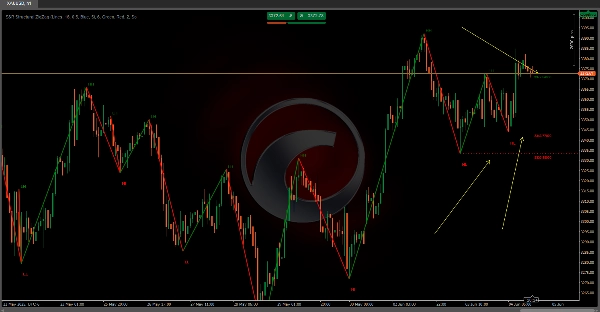
📉 Zeichnet Zigzag-Trendlinien
- Verbindet Schwünge mit dynamischen Linien:
-
- 🟢 Grün = Aufwärtstrend (neuer Schwung > vorheriger).
- 🔴 Rot = Abwärtstrend (neuer Schwung < vorheriger).
⏹️ Hebt Schlüssel-Niveaus hervor
- Unterstützungs-/Widerstandslinien: Gezeichnet auf dem genauen Preis jedes Schwungs, nach rechts verlängert
- Beschriftungen zeigen Preiswerte 📌 (z.B. "1.1050") für sofortige Analyse.
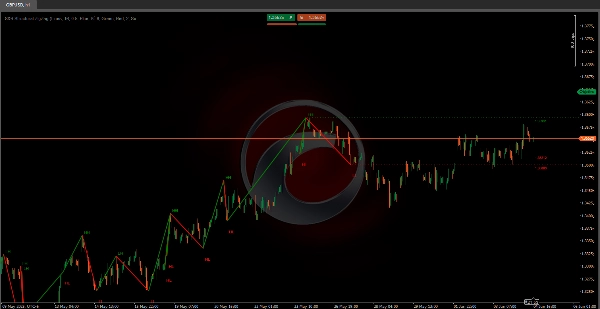
🚦 Zeigt Marktstruktur
- Erkennt Trends auf einen Blick:
-
- Bullisch = Höhere Hochs (HH) + Höhere Tiefs (HL).
- Bärisch = Niedrigere Hochs (LH) + Niedrigere Tiefs (LL).
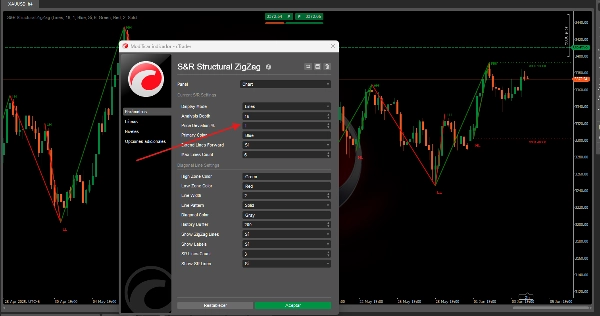
2. Wie man es benutzt (Setup-Anleitung) ⚙️
Installation auf cTrader: Ziehen Sie es per Drag & Drop auf Ihr Chart!
Wichtige Einstellungen:
- Analyse-Tiefe 🔎:
10(Standard) → Höhere Werte filtern Rauschen; niedrigere Werte erfassen mehr Schwünge. - Preisabweichung % 📏:
1.0%(anpassbar) → Minimale Preisänderung zur Validierung von Schwüngen. - Swing-Beschriftungen 🏷️ (HH/HL/LH/LL): Ein-/Ausschalten.
- Linien verlängern ➡️: S/R-Niveaus unendlich projizieren oder auf aktuelle Balken begrenzen.
Zusammenfassung
Kundenbewertungen
5 | 100 % | |
4 | 0 % | |
3 | 0 % | |
2 | 0 % | |
1 | 0 % |


