설명
소개
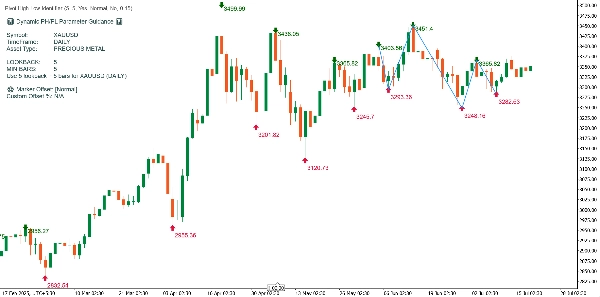
표시된 차트는 맞춤형 "개선된 PH/PL 시각화" cTrader 지표를 사용합니다. 이 도구는 중요한 스윙 고점과 저점(PH/PL)을 동적으로 식별하고, 이들 사이에 지그재그 추세선을 그리며, 감지된 심볼, 시간 프레임 및 자산 유형을 기반으로 유용한 안내 패널을 생성합니다. 아래는 지표가 샘플 차트를 처리하고 주석을 다는 방법에 대한 자세한 설명입니다.
차트에 표시된 주요 요소
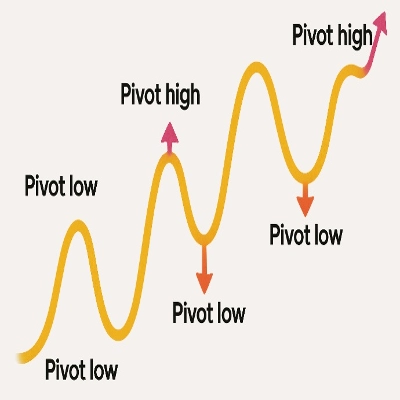
1. 피벗 고점(PH) 및 피벗 저점(PL)
- 피벗 고점: 녹색 아래쪽 화살표와 해당 고가가 봉 위에 표시됩니다.
- 피벗 저점: 빨간색 위쪽 화살표와 해당 저가가 봉 아래에 표시됩니다.
- 사용된 논리: PH는 해당 봉의 고가가 앞뒤 'lookback' 봉들의 고가보다 높을 때 발생하며, PL은 저가에 대해 유사하게 정의됩니다.
- Lookback 설정: 코드와 차트에서는 5의 lookback이 사용되어 일간 데이터에 적합한 견고한 스윙 감지를 제공합니다.
2. 가격 라벨
- 표시 토글 가능: 각 PH/PL 마커에 부착된 가격 라벨은 지표 매개변수를 통해 표시하거나 숨길 수 있습니다. 이 예에서는 명확성을 위해 가격이 표시됩니다.
- 오프셋 자동 조정: 라벨 위치는 최적 간격(기본값 또는 사용자 지정)을 사용하여 알고리즘적으로 조정되어 텍스트가 캔들 또는 차트 요소와 겹치지 않도록 합니다.
3. 동적 지그재그 추세선
- 시각화: 파란색 지그재그 선이 가장 최근의 중요한 PH/PL 지점을 연결하여 주요 가격 스윙의 순서를 강조합니다.
- 목적: 이는 트레이더가 차트 기간 동안 변화하는 추세와 모멘텀 변화를 시각적으로 추적하는 데 도움을 줍니다.
4. 동적 안내 패널
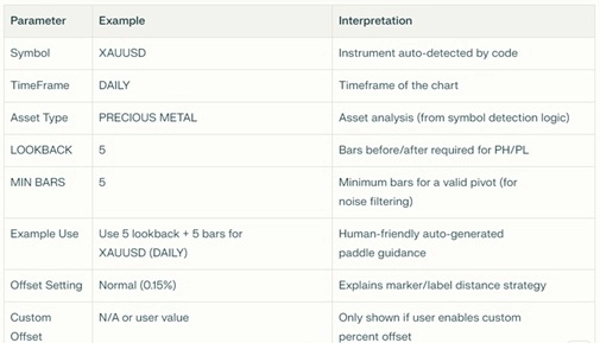
왼쪽 상단 차트 패널은 주요 설정, 감지 결과 및 사용 권장 사항을 요약합니다
이 차트에서 지표 작동 방식
단계별 설명:
- 스윙 식별:
지표는 초기화 후 매일 봉을 스캔하며, 양쪽 5봉 간격 내의 고가와 저가를 비교하여 PH와 PL을 정확히 찾아냅니다. - 마커 배치:
PH와 PL은 색상 화살표로 표시되며, 해당 가격 라벨은 명확성을 위해 최적 거리로 배치됩니다. - 추세 시각화:
알고리즘은 가장 최근 10개의 피벗(PH/PL, 구성 가능)을 선택하여 파란 선으로 연결하며, 주요 시장 스윙을 그려내고 추세 인식에 도움을 줍니다. - 매개변수 패널:
표시 패널은 자산 유형(XAUUSD, "귀금속")의 자동 감지를 확인하고, 이 조합에 대한 최적 권장 값(lookback, 최소 봉 수, 오프셋)을 사용자에게 잠시 보여줍니다. - 스마트 자산 적응:
이 지표를 다른 심볼(예: 외환 이국통화, 암호화폐, 주가지수)에 적용하면 안내 패널과 감지 논리가 자동으로 조정되어 해당 시장 행동과 시간 프레임에 맞는 권장 lookback 및 최소 봉 수를 설정합니다. - 깨끗한 차트 경험:
그려진 모든 그래픽 객체(화살표, 추세선, 가격 라벨, 고정 텍스트)는 계산 시마다 정리되고 다시 그려져 혼란을 방지합니다. 지표는 항상 가격 차트 위에 정보를 오버레이하며 별도의 패널에서는 표시되지 않습니다.
거래를 위한 실용적 시사점
- 스윙 구조 인식: 시장 스윙의 순서와 크기를 빠르게 파악할 수 있습니다.
- 진입/청산 계획: PH/PL 전환점을 추적 정지 논리나 잠재적 반전 지점 예측에 활용할 수 있습니다.
- 범용 사용: 자산이나 시간 프레임에 관계없이 지표가 자동 조정되고 권장 사항을 설명합니다.
- 명확하고 전문적인 시각화: 스마트 오프셋 덕분에 가격 혼잡과 라벨 겹침이 최소화됩니다.
요약
이 차트는 개선된 PH/PL 시각화의 강력함과 명확성을 보여줍니다. 지표는 주요 피벗 포인트, 스윙의 방향과 크기, 그리고 도구 및 시간 프레임에 특화된 맥락적 안내를 즉각적으로 제공합니다. 모든 것이 자동화되어 최신 상태이며, 어떤 자산이나 시장 환경에도 맞춤 설정 가능합니다.
참고: cTrader의 제한으로 인해 지표가 새 패널에 배치 옵션을 표시하지만, 크기와 기능 때문에 새 패널에서 볼 수 없으므로 적용되지 않습니다. 또한 가격이 피벗 화살표에서 너무 멀리 표시되어 사용자가 혼란스러울 경우, 사용자가 수동으로 가격 표시 여부를 선택할 수 있습니다.
피벗에서 소리/알림 신호나 작은 스윙에 대한 동적 필터링 같은 추가 맞춤화가 필요하면 언제든지 요청하세요!
요약
지표 프로필
고객 리뷰
0.0
리뷰: 0
고객 리뷰
이 상품에 대한 리뷰가 아직 없습니다. 이미 사용해 보셨나요? 다른 사람들에게 가장 먼저 소개해 주세요!
상담
자주 묻는 질문(FAQ)
트레이딩 봇, 지표, 플러그인 등 cTrader Store에서 제공되는 상품은 제3자 개발자에 의해 제공되며, 이는 단순히 정보 및 기술적 접근을 목적으로 제공된 것입니다. cTrader Store는 중개인이 아니며, 투자 조언, 개인별 추천 또는 향후 성과에 대한 어떠한 보장도 제공하지 않습니다.


가격
가입일 19/07/2025