
COSA FA
Donchian Channel con Contesto Temporale sovrappone i confini strutturali di timeframe superiori al tuo grafico attuale — fornendo a ogni breakout e ritracciamento un quadro di riferimento che i canali Donchian standard non offrono.
Il canale Donchian standard traccia il massimo più alto e il minimo più basso su un periodo di lookback fisso nel tuo timeframe attuale. È efficace per l'identificazione dei breakout — ma opera in isolamento. Un breakout su un grafico a 15 minuti potrebbe non essere altro che rumore all'interno di un intervallo settimanale.
Questo indicatore aggiunge quel contesto mancante.
Calcola l'intervallo del periodo precedente di timeframe superiore e lo proietta come zone di supporto/resistenza sul tuo grafico di esecuzione. Vedi entrambi: il canale Donchian standard che traccia gli estremi di prezzo del timeframe corrente e il contesto di timeframe superiore che mostra dove il prezzo si trova rispetto a confini strutturali più ampi.
Il risultato è un canale Donchian che sa dove si trova nel quadro più ampio.
PERCHÉ IL CONTESTO TEMPORALE È IMPORTANTE
Il canale Donchian è uno dei sistemi di breakout più rispettati nel trading. Il concetto originale di Richard Donchian — compra al massimo più alto, vendi al minimo più basso — rimane la base delle strategie di trend-following. Ma il canale da solo non ti dice se il breakout che stai vedendo è strutturalmente significativo.
Il Problema
Un breakout Donchian standard sul timeframe del tuo grafico crea una serie di frustrazioni comuni:
- Il prezzo rompe sopra il canale superiore su H1 — ma l'intervallo settimanale ti dice che sta incontrando resistenza, non iniziando un trend
- Il prezzo testa il canale inferiore su M15 — ma il contesto giornaliero mostra una forte domanda sotto che non è stata testata
- Entri in un trade di breakout con fiducia — solo per vedere il prezzo invertire perché il movimento era correttivo all'interno di una struttura di timeframe più grande
Questi non sono fallimenti dell'indicatore. Sono fallimenti di contesto. Il canale funziona esattamente come progettato — semplicemente non conosce i confini strutturali di un timeframe superiore.
La Soluzione
Questo indicatore proietta l'intervallo Donchian del periodo precedente di timeframe superiore come zone visive sul tuo grafico attuale. Quando il prezzo si avvicina alla linea superiore o inferiore del canale standard, vedi immediatamente se si sta dirigendo verso o lontano dal confine di timeframe superiore.
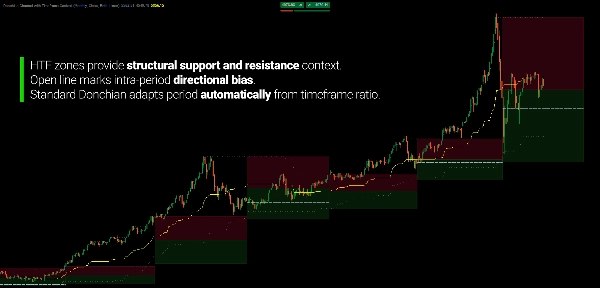
Le zone di timeframe superiore dividono il periodo corrente in territorio di resistenza (sopra il punto medio) e territorio di supporto (sotto il punto medio) — fornendoti un bias strutturale prima che il breakout si verifichi.
IL CONCETTO FONDAMENTALE
Le risposte tradizionali di Donchian: "Quali sono i prezzi più alti e più bassi negli ultimi N barre?"
Questo indicatore aggiunge: "Dove si colloca quell'intervallo rispetto all'intervallo del periodo precedente di timeframe superiore?"
Il sistema funziona su due livelli:
- Canale Donchian Standard calcolato sul tuo grafico attuale con un periodo adattato automaticamente. Il periodo deriva dal rapporto tra il contesto di timeframe selezionato e il timeframe del grafico — nessuna impostazione manuale richiesta. Un contesto settimanale su un grafico H1 utilizza automaticamente un lookback di 120 barre (5 giorni × 24 ore ÷ 1 ora).
- Zone di Contesto Temporale calcolano il prezzo più alto e più basso del periodo precedente di timeframe superiore, quindi proiettano quei livelli come zone colorate nel periodo corrente. La zona di supporto si estende dal confine inferiore al punto medio. La zona di resistenza si estende dal punto medio al confine superiore.
Quando si verifica un breakout Donchian standard all'interno della zona di supporto, il contesto di timeframe superiore suggerisce che il movimento ha spazio. Quando si verifica all'interno della zona di resistenza, il contesto suggerisce cautela — il breakout sta spingendo contro una fornitura strutturale più ampia.
APPLICAZIONE PRATICA
Filtraggio dei Falsi Breakout
Il caso d'uso principale. Quando il prezzo rompe sopra la linea superiore standard del canale ma è già profondamente all'interno della zona di resistenza HTF, il breakout comporta un rischio maggiore di inversione. La zona fornisce il contesto per distinguere tra espansione genuina e sondaggio esaustivo nella fornitura sopra la testa.
Al contrario, un breakout che si verifica vicino al punto medio HTF ha più spazio strutturale per svilupparsi prima di incontrare il confine più grande.
Esaurimento della Correzione
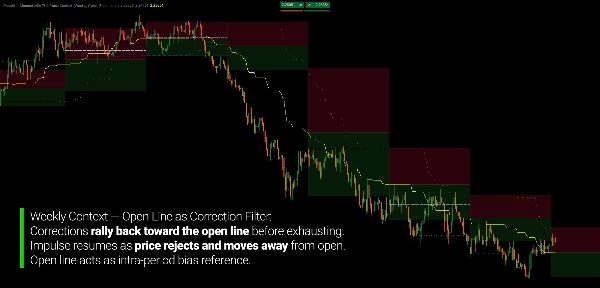
Durante i ritracciamenti all'interno di un trend, le zone di supporto/resistenza HTF ti forniscono un riferimento strutturale per dove la correzione potrebbe esaurirsi. Un ritracciamento che raggiunge il confine della zona di supporto HTF suggerisce che i venditori potrebbero aver esaurito la loro energia a un livello strutturale — preparati a una possibile inversione. Un ritracciamento che si ferma prima di raggiungere la zona suggerisce che il trend rimane forte.
Posizionamento Strutturale
Prima che si attivi qualsiasi segnale di breakout, le zone ti dicono dove il prezzo si trova attualmente all'interno dell'intervallo di timeframe superiore. Metà superiore dell'intervallo HTF = cautela per i long. Metà inferiore = cautela per gli short. Vicino al punto medio = zona neutra dove la direzione è meno definita.
Riferimento Prezzo di Apertura
La linea opzionale del prezzo di apertura indica dove è iniziato il periodo corrente di timeframe superiore. Questo fornisce un riferimento aggiuntivo per il bias intra-periodo — prezzo sopra l'apertura suggerisce controllo rialzista, sotto suggerisce controllo ribassista.
CARATTERISTICHE PRINCIPALI
Sistema Donchian a Doppio Livello
- Canale Donchian standard con periodo calcolato automaticamente basato sul rapporto tra timeframe
- Zone di contesto di timeframe superiore proiettate come supporto/resistenza sul grafico corrente
- Entrambi i livelli si aggiornano in tempo reale con l'arrivo di nuovi dati di prezzo
Calcolo Automatico del Periodo
- Il periodo deriva dal rapporto tra il timeframe di contesto e il timeframe del grafico
- Nessuna impostazione manuale del periodo — il timeframe di contesto definisce automaticamente il lookback
- Supporta grafici non basati sul tempo (Tick, Renko, Range) con impostazione predefinita configurabile
Opzioni di Contesto Temporale
- 13 selezioni di timeframe: da Mensile a 15 Minuti
- Applica contesto Settimanale su grafico H1, contesto Giornaliero su grafico M5, o qualsiasi combinazione valida
- Le zone si aggiornano ogni volta che inizia un nuovo periodo di timeframe superiore
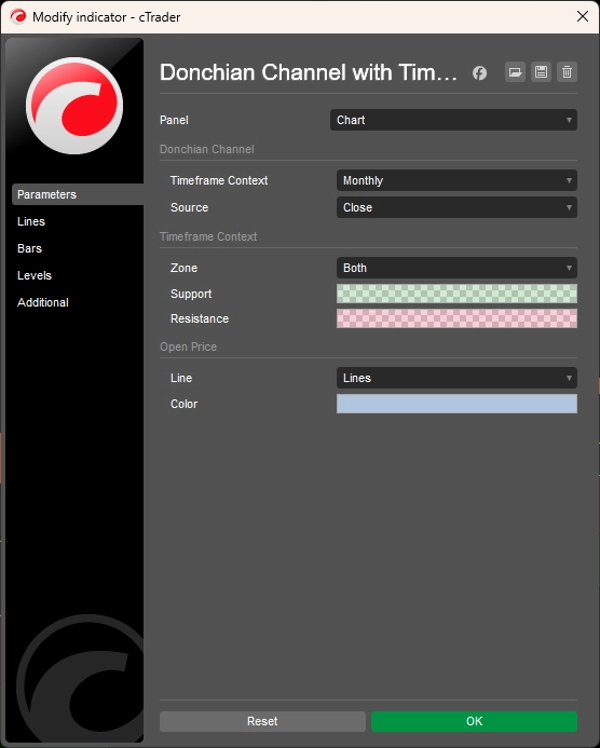
Visualizzazione delle Zone
- Zona di supporto (confine inferiore al punto medio) — colore configurabile con trasparenza
- Zona di resistenza (punto medio al confine superiore) — colore configurabile con trasparenza
- Modalità di visualizzazione: entrambe le zone, solo supporto, solo resistenza o nessuna
- Le zone si proiettano fino alla fine del periodo HTF corrente
Linea del Prezzo di Apertura
- Segna il prezzo di apertura del periodo corrente di timeframe superiore
- Sei opzioni di stile linea: Solido, Punti, PuntiRari, PuntiMoltoRari, Linee, LineePunti
- Colore configurabile — o disabilitabile completamente
Flessibilità della Fonte Prezzo
- Calcolo basato sulla chiusura: usa i prezzi di chiusura per i confini del canale
- Calcolo basato su HighLow: usa le ombre alte/basse per confini del canale più ampi
- Un'unica impostazione si applica sia al calcolo standard che a quello di contesto
LETTURA DEL GRAFICO
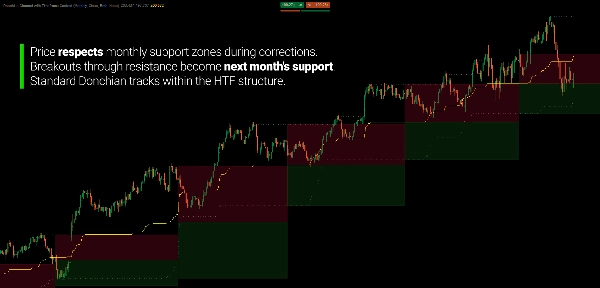
- Zona Verde: Territorio di supporto — intervallo inferiore del periodo HTF precedente proiettato in avanti
- Zona Rossa: Territorio di resistenza — intervallo superiore del periodo HTF precedente proiettato in avanti
- Confine della Zona (alto): Prezzo più alto del periodo HTF precedente
- Confine della Zona (basso): Prezzo più basso del periodo HTF precedente
- Punto Medio della Zona: Dove si incontrano le zone di supporto e resistenza — equilibrio del periodo precedente
- Linee del Canale Standard: Donchian superiore/inferiore/centrale del timeframe corrente
- Linea di Apertura: Dove è iniziato il periodo HTF corrente
Valutazione del Breakout:
- Breakout standard DENTRO la zona di supporto HTF → allineato al trend, spazio strutturale
- Breakout standard DENTRO la zona di resistenza HTF → contro-strutturale, rischio di inversione maggiore
- Breakout standard OLTRE la zona HTF → nuovo territorio, la struttura precedente non contiene più il prezzo
A CHI È RIVOLTO
Questo indicatore è progettato per trader che utilizzano i canali Donchian per il trading di breakout e vogliono un contesto strutturale di timeframe superiore per filtrare i loro segnali.
Se hai sperimentato la frustrazione di entrare in breakout Donchian che si invertono immediatamente — perché stavano spingendo contro un confine strutturale più grande che non potevi vedere — questo strumento fornisce quella visibilità.
È adatto a trader trend-following che vogliono criteri oggettivi per distinguere tra breakout genuini e sonde esaustive nella fornitura o domanda sopra la testa. Analisti multi-timeframe trarranno beneficio dal vedere il contesto dell'intervallo di timeframe superiore direttamente sui grafici di esecuzione senza cambiare timeframe.
Trader swing possono usare le zone HTF come riferimento strutturale per gli ingressi in ritracciamento — identificando dove le correzioni probabilmente si esauriranno in base ai confini del periodo precedente. Trader discrezionali guadagnano un ulteriore livello strutturale di contesto senza aggiungere complessità all'indicatore.
Non è un sistema di segnali. È un overlay contestuale che ti aiuta a valutare i breakout Donchian nel quadro della struttura di mercato di timeframe superiore.
COS'È CHE LO RENDE DIVERSO
Gli indicatori standard Donchian operano su un singolo timeframe con un periodo fisso. Ti dicono quando il prezzo supera gli estremi recenti — ma nulla su se quell'estremo abbia importanza strutturale.
Questo indicatore introduce la consapevolezza del timeframe superiore direttamente nel framework Donchian. Le zone di contesto rispondono a domande che i canali standard non possono: questo breakout sta spingendo nella fornitura strutturale? Questo ritracciamento sta raggiungendo la domanda strutturale? Dove mi trovo nell'intervallo più grande?
Il calcolo automatico del periodo elimina una fonte comune di ansia sui parametri. Invece di scegliere tra lookback di 20, 50 o 100 barre, il periodo deriva naturalmente dalla relazione tra timeframe. Il contesto settimanale su un grafico orario produce automaticamente il lookback corretto — nessuna ottimizzazione richiesta.
Il risultato è un canale Donchian che opera con consapevolezza strutturale anziché in isolamento.
---
COMPRENDERE IL CONTESTO MULTI-TIMEFRAME NEL TRADING DI BREAKOUT
Il trading di breakout è semplice nel concetto: il prezzo supera un confine di intervallo, suggerendo un impegno direzionale. La sfida non è identificare i breakout — è distinguere tra breakout che portano a trend e breakout che falliscono immediatamente.
La maggior parte dei falsi breakout condivide una caratteristica comune: si verificano a un livello strutturalmente significativo su un timeframe superiore. Un breakout a 15 minuti nella resistenza settimanale non è affatto un breakout dalla prospettiva settimanale — è un test di un confine noto.
Ecco perché il contesto multi-timeframe è fondamentale per la valutazione del breakout. Il breakout stesso avviene sul tuo timeframe di esecuzione. Ma la sua importanza è determinata da dove si verifica all'interno della struttura di timeframe superiore.
Gli indicatori che forniscono questo contesto non prevedono quali breakout avranno successo. Ti aiutano a comprendere l'ambiente strutturale in cui ogni breakout si verifica — così puoi valutare il rischio più accuratamente ed evitare di prendere posizioni che contrastano la struttura più ampia.
Il timeframe superiore non sovrascrive quello inferiore. Lo contestualizza.
---
Il trading comporta rischi. Questo indicatore è uno strumento di analisi tecnica — applica sempre una corretta gestione del rischio.


