Descrizione
━━━━━━━━━━━━━━━━━━━━━━━━━━━━━━━━━━━━━━━━
ATR Risk Visualizer — Rischio
━━━━━━━━━━━━━━━━━━━━━━━━━━━━━━━━━━━━━━━━
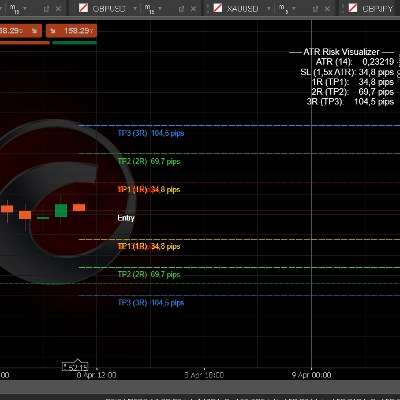
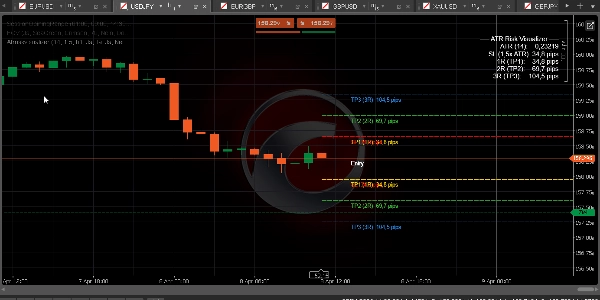
Visualizza istantaneamente i tuoi livelli di Stop Loss e Take Profit basati su ATR — con mappatura completa dei multipli R (da 1R a 5R) e etichette pip — così puoi sempre operare con un rischio definito prima di entrare in una posizione.
─────────────────────────────
CARATTERISTICHE PRINCIPALI
► Stop Loss basato su ATR — distanza SL calcolata come ATR × moltiplicatore configurabile (default 1.5×)
► Take Profit a multipli R — TP1 (1R), TP2 (2R), TP3 (3R), TP4 (4R), TP5 (5R) disegnati automaticamente dal prezzo corrente
► Etichette pip su ogni livello — visualizza a colpo d'occhio la distanza esatta in pip per SL e ogni TP
► Livelli Long e Short simultaneamente — o passa alla modalità solo Long o solo Short
► Selettore timeframe ATR — calcola l'ATR da un timeframe superiore (es. ATR H1 su grafico M15)
► Pannello informazioni ATR (in alto a destra) — mostra valore ATR, dimensione SL e TP1/2/3 in pip
► Controllo completo dei colori — colori separati per SL, TP1, TP2, TP3, TP4/5 tramite i selettori colore nativi di cTrader
► Stile linea configurabile (Solido / Tratteggi / Punti) e spessore
► Prezzo Ask o Bid come riferimento di ingresso — scegli in base alla direzione del tuo trade
─────────────────────────────
IMPOSTAZIONI PREDEFINITE
→ Periodo ATR 14
→ Moltiplicatore ATR 1.5× (SL = 1.5 × ATR)
→ Timeframe ATR H1
→ Mostra TP1/2/3 ATTIVO
→ Mostra TP4/5 DISATTIVO
→ Direzione Entrambi (Long + Short)
→ Colore SL Rosso
→ Colore TP1 Oro
→ Colore TP2 Verde Lime
→ Colore TP3 Azzurro Dodger
→ Stile linea Tratteggi
─────────────────────────────
COME USARLO
1. Aggiungi l'indicatore a qualsiasi grafico
2. Imposta Periodo ATR e Moltiplicatore per adattarli alla tua strategia (1.5× ATR è standard per Forex/Oro)
3. Imposta Timeframe ATR su H1 o H4 per una dimensione SL più fluida
4. Leggi i valori in pip direttamente dalle etichette sul grafico
5. Usa TP1 (1R) per la prima uscita parziale, TP2 (2R) per il pareggio, TP3 (3R) per l'obiettivo completo
6. Combina con gli indicatori BOS/CHoCH e FVG per un flusso di lavoro completo di ingresso SMC
─────────────────────────────
IDEALE PER
✔ Trader FTMO e prop firm che devono dimensionare il rischio con precisione
✔ Trader SMC e ICT che usano multipli R per la gestione del trade
✔ Trader Forex, Oro e Indici su qualsiasi timeframe
✔ Trader che vogliono una mappa visiva chiara del rischio prima di ogni ingresso
✔ Chiunque costruisca un approccio sistematico al dimensionamento delle posizioni
─────────────────────────────
COMPATIBILITÀ
→ Piattaforma cTrader (Desktop & Web)
→ Classi di asset Forex, Indici, Commodities, CFD Crypto
→ Timeframe Tutti (M1 a MN)
→ Diritti di accesso Nessuno richiesto
→ Tipo di conto Live & Demo
━━━━━━━━━━━━━━━━━━━━━━━━━━━━━━━━━━━━━━━━
Riepilogo
Recensioni dei clienti
5 | 50 % | |
4 | 50 % | |
3 | 0 % | |
2 | 0 % | |
1 | 0 % |


![Logo di "[Stellar Strategies] Market Session Ultimate"](https://cdn.ctrader.com/image/webp/61ffd537-0125-4246-9e72-42eca1791d64_28232)
