
Descrizione
Il Support & Resistance Toolkit è un indicatore completo di analisi della struttura di mercato progettato per aiutare i trader a identificare zone di supporto e resistenza ad alta probabilità sui grafici. Combinando più algoritmi avanzati di rilevamento dei pivot point con zone di volatilità adattive, filtri di flusso di denaro istituzionale e analisi della liquidità, questo toolkit trasforma le tradizionali linee di supporto e resistenza in uno strumento strategico basato sui dati.
Rilevamento
Questo toolkit include quattro metodologie avanzate di rilevamento progettate per adattarsi a diversi stili di trading e ambienti di mercato:
- Pivot: L'approccio classico per il rilevamento di supporti e resistenze che utilizza intensità di lookback configurabili a sinistra e a destra per individuare massimi e minimi locali.
- Donchian: Un algoritmo a macchina a stati ad alte prestazioni che rileva strutture oscillanti alternate. Invece di usare un ritardo fisso, conferma gli estremi quando il mercato cambia stato direzionale.
- CSID: Un metodo di rilevamento guidato dal momentum che identifica punti di svolta strutturali basati su candele consecutive rialziste o ribassiste, evidenziando zone di forte inizio di trend.
- ZigZag: Un algoritmo basato sulla volatilità che filtra le fluttuazioni di prezzo minori richiedendo una deviazione percentuale minima prima di identificare un'oscillazione.
Zona / Livello
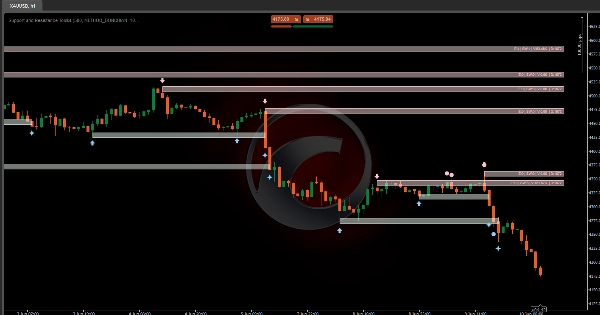
A differenza degli indicatori convenzionali che disegnano semplicemente linee fisse, questo strumento tratta i livelli di supporto e resistenza come zone di prezzo dinamiche basate sulle seguenti caratteristiche:
- Profondità della Zona (ATR Mult): Determina lo spessore di ogni zona basandosi sull'Average True Range. Questo permette alle zone di scalare automaticamente con la volatilità del mercato.
- Buffer di Breakout (ATR Mult): Un buffer di sicurezza unico che estende la zona oltre il lato del breakout. Il prezzo deve superare questo ulteriore strato di volatilità prima che l'indicatore confermi un breakout, riducendo segnali falsi e falsi breakout.
Filtraggio & Visibilità:
- Unisci Sovrapposizioni: Combina le zone che si intersecano in una “Super Zona” più grande che rappresenta l'intero intervallo di interazione storica.
- Nascondi Prima le Più Vecchie: Prioritizza la struttura di mercato recente nascondendo le zone più vecchie quando si verifica una sovrapposizione.
- Nascondi Prima le Più Giovani: Preserva le strutture storiche consolidate ignorando le nuove zone più piccole che appaiono all'interno degli intervalli esistenti.
Filtraggio dei Livelli ( E:Entrate | S:Forza | SW:Spazzate | V:Volume | D:Durata )
- Entrate di Prezzo (E): Richiede che un livello venga ritestato un numero specificato di volte prima di apparire sul grafico.
- Spazzate (SW): Rileva trappole di liquidità dove il prezzo viola brevemente un livello con una ombra ma chiude nuovamente all'interno della zona.
- Volume Scambiato (V): Monitora il volume totale scambiato che si verifica mentre il prezzo interagisce con la zona, evidenziando la partecipazione istituzionale.
- Durata (D): Richiede che le zone sopravvivano per un numero minimo di barre prima di essere considerate livelli strutturali validi.
Segnali Visivi
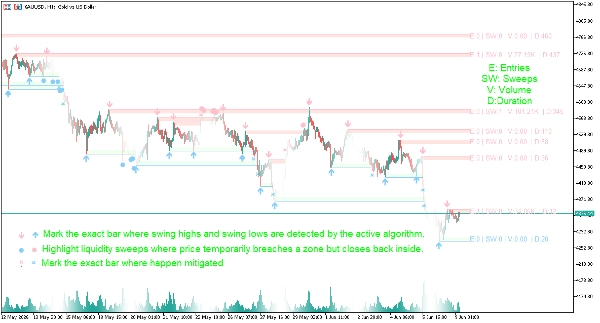
- Frecce ⬆/⬇: Indicano la barra esatta dove vengono rilevati i massimi e minimi oscillanti dall'algoritmo attivo.
- ● Punti Grandi: Evidenziano le spazzate di liquidità dove il prezzo supera temporaneamente una zona ma chiude nuovamente all'interno.
- ✖ Croce: Indicano la barra esatta dove massimi e minimi oscillanti sono migrati.
- Etichette di riepilogo: Ogni area di visualizzazione presenta un'etichetta dati concisa che include i parametri E (Entrate), S (Forza), SW (Spazzate), V (Volume) e D (Durata), permettendo agli utenti di valutare rapidamente la qualità strutturale.
Dashboard
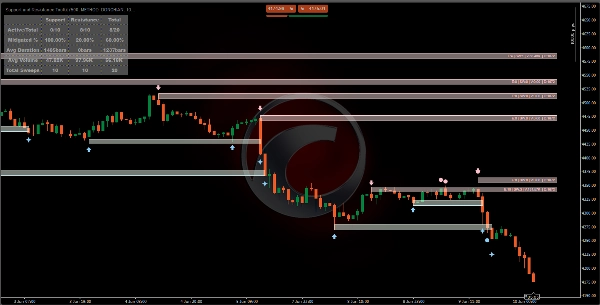
- Attivi / Totali: Mostra quante strutture sono attualmente attive rispetto al totale rilevato storicamente.
- % di Mitigazione: Misura la frequenza con cui i livelli vengono rotti o mitigati, fornendo informazioni sull'affidabilità della struttura di mercato.
- Durata Media: Il numero medio di barre che una zona di supporto o resistenza sopravvive prima di essere rotta.
- Volume Medio: Indica la partecipazione istituzionale media all'interno delle zone prima che si verifichi un breakout.
- Totale Spazzate: Monitora il comportamento di caccia alla liquidità nel mercato.
Impostazioni dell'Indicatore
Impostazioni di Rilevamento
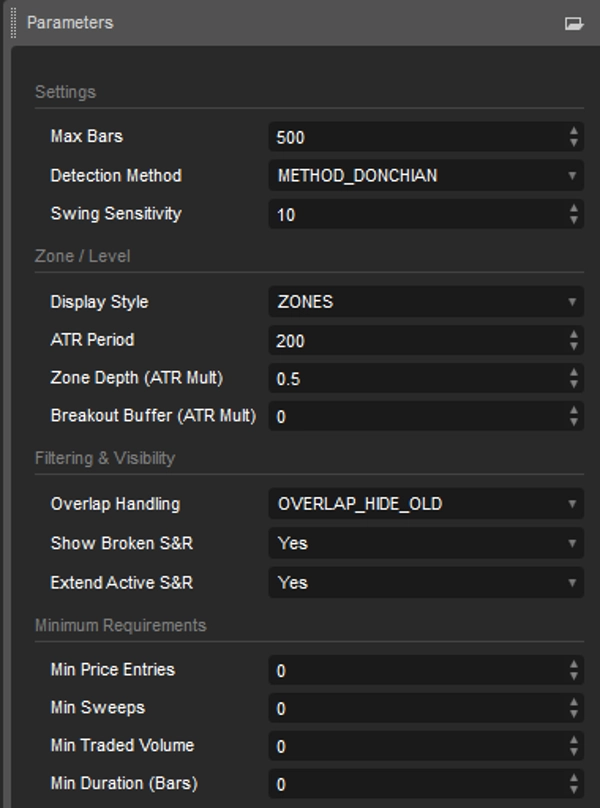
- Metodo di Rilevamento: Seleziona tra la logica di rilevamento degli swing Pivots, Donchian, CSID o ZigZag.
- Sensibilità dello Swing: Regola la deviazione richiesta o la lunghezza del lookback necessaria per confermare massimi e minimi oscillanti.
Configurazione di Zona & Livello
- Stile di Visualizzazione: Passa tra linee precise orizzontali di supporto e resistenza o zone basate su ATR.
- Periodo ATR: Determina il periodo di volatilità utilizzato per i calcoli delle zone.
- Profondità della Zona (ATR Mult): Regola lo spessore delle zone di supporto e resistenza.
- Buffer di Breakout (ATR Mult): Aggiunge un buffer di volatilità per filtrare i falsi breakout.
Visibilità del Grafico & Controllo della Struttura
- Gestione delle Sovrapposizioni: Scegli come gestire le zone sovrapposte (Unisci, Nascondi le più vecchie o Nascondi le più giovani).
- Max Attivi (Non Mitigati): Limita il numero di zone di supporto e resistenza attive visualizzate sul grafico.
- Mostra S&R Rotti: Attiva o disattiva la visibilità dei livelli rotti per l'analisi storica.
- Estendi S&R Attivi: Proietta i livelli attivi nelle barre di prezzo future.
Requisiti Strutturali Minimi
- Minimo Entrate di Prezzo: Imposta il numero richiesto di ritest prima che un livello diventi visibile.
- Minimo Spazzate: Richiede un certo numero di spazzate di liquidità prima di mostrare la zona.
- Minimo Volume Scambiato: Garantisce che le zone soddisfino una soglia minima di partecipazione istituzionale.
- Minima Durata (Barre): Richiede che i livelli esistano per un numero specificato di barre prima che appaiano.
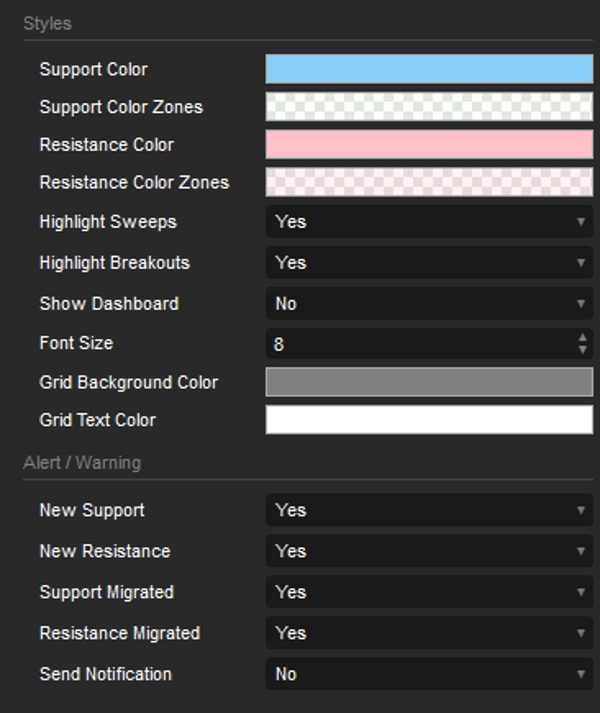
Stili e Avvisi
- Stili: Regola la configurazione del colore degli oggetti. Nascondi/Mostra Dashboard.
- Avviso: Attiva/disattiva gli avvisi ogni volta che viene rilevato un nuovo S&R o un S&R viene migrato.
Riepilogo
Unlike traditional fixed lines, this tool defines support and resistance as dynamic price zones, with thickness and breakout buffers scaled by Average True Range (ATR) to adapt to market volatility. It features zone merging and selective visibility options to manage overlapping zones, prioritizing recent or historical structures as needed.
The indicator applies multiple filters based on price re-tests, liquidity sweeps, traded volume, and zone duration to validate structural levels. Visual signals include arrows marking swing points, dots highlighting liquidity sweeps, crosses for migrated swings, and summary labels displaying entries, strength, sweeps, volume, and duration metrics.
A dashboard provides real-time statistics on active versus total structures, mitigation percentages, average zone duration, volume, and liquidity sweep counts. Users can customize detection methods, sensitivity, zone display styles, ATR parameters, overlap handling, and structural requirements. Alerts can be enabled for new or migrated support and resistance levels.
This toolkit supports detailed market structure analysis with data-driven, volatility-adjusted zones to assist traders in identifying key price areas.


![Logo di "[Stellar Strategies] MARSI Signal Plotter"](https://cdn.ctrader.com/image/webp/7b2b8da6-8f8e-4646-8d4a-4710c516c01e_25567)


