Candle Pro
Indicateur
121 téléchargements
Version 1.0, Oct 2025
Windows, Mac
5.0
Avis : 1
Description
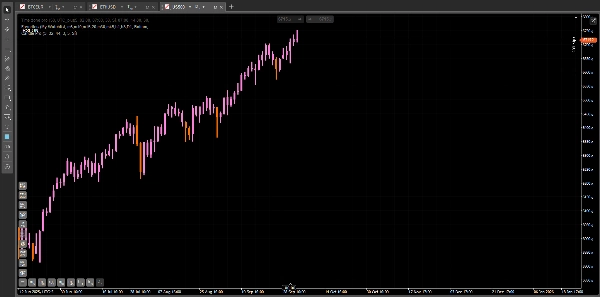
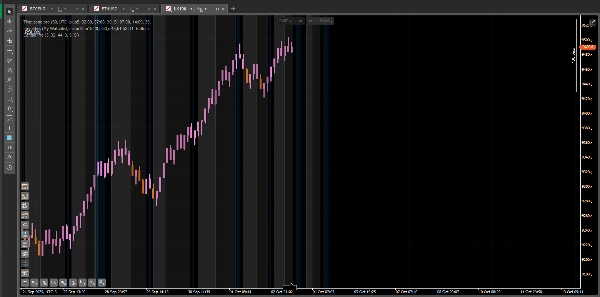
Candle Pro – Signaux RSI visuels sur les chandeliers
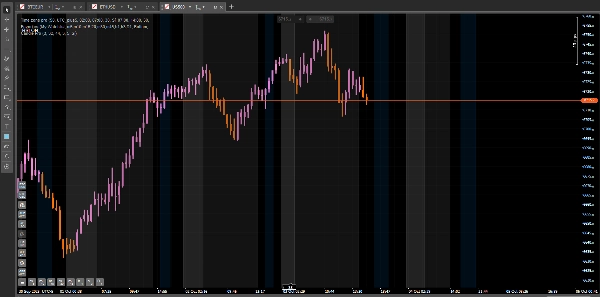
Candle Pro est un indicateur qui met en évidence les chandeliers directement sur le graphique lorsque le RSI atteint des niveaux de surachat ou de survente, vous permettant de rester concentré sur l'action des prix et d'éviter des sous-graphiques supplémentaires.
🧭 Comment utiliser
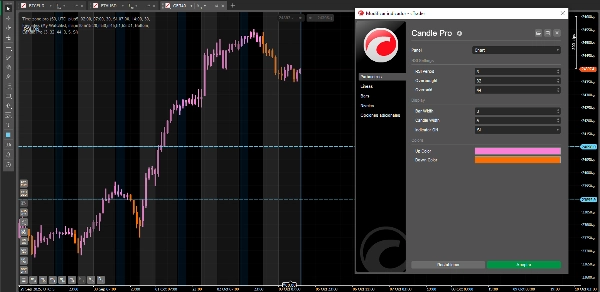
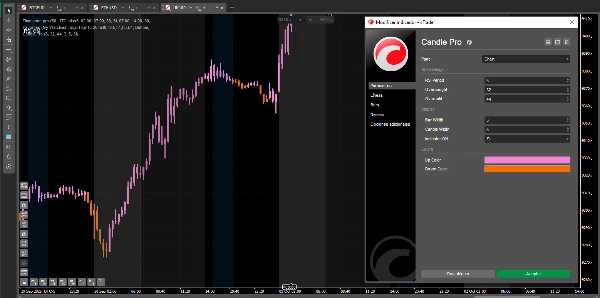
- Ajoutez l'indicateur à votre graphique.
- Ajustez les paramètres du RSI pour correspondre à votre style de trading.
- Observez comment les chandeliers changent de couleur aux niveaux extrêmes, marquant des zones potentielles de retournement ou de momentum.
⚙️ Paramètres suggérés
Pour une réponse rapide et précise :
- Période RSI : 3
- Surachat : 32
- Survente : 44
- Largeur du chandelier : 3
- Largeur de la barre : 1
✨ Avantages
- Signaux visuels clairs directement sur le prix.
- Fonctionne avec n'importe quel symbole et intervalle de temps.
- Couleurs et largeurs de ligne entièrement personnalisables.
- Parfait pour le scalping, le trading intraday, et le swing trading.
Note : Ceci est la version gratuite de Candle Pro. Une version premium arrive bientôt, avec des fonctionnalités exclusives pour porter votre trading au niveau supérieur.
Résumé
Résumé IA
Candle Pro is a trading indicator designed to visually highlight RSI (Relative Strength Index) signals directly on price candles, eliminating the need for separate RSI sub-charts. It marks candles on the chart when RSI reaches overbought or oversold levels, helping traders identify potential reversal or momentum zones. Users can customize RSI parameters, candle colors, and line widths to suit their trading style. The indicator supports any symbol and timeframe, making it suitable for scalping, intraday, and swing trading strategies. Suggested settings include an RSI period of 3, overbought level at 32, and oversold level at 44 for fast and precise signals. Candle Pro emphasizes clean visual cues integrated with price action to maintain chart clarity. This version is the free edition, with a premium version planned to offer additional features. Supported markets include Forex, Indices, and Crypto.
Profil de l'indicateur
Avis clients
5.0
Avis : 1
5 | 100 % | |
4 | 0 % | |
3 | 0 % | |
2 | 0 % | |
1 | 0 % |
Avis clients
November 3, 2025
This is an interesting indicator it really helps to filter out market noise. Thanks
Discussion
Questions fréquentes
Forex
Indices
RSI
Crypto
Les produits disponibles sur cTrader Store, notamment les bots de trading, les indicateurs et les plug-ins, sont fournis par des développeurs tiers et mis à disposition à titre informatif et à des fins d'accès technique uniquement. cTrader Store n'est pas un courtier et ne fournit aucun conseil en investissement, aucune recommandation personnelle ni aucune garantie quant aux performances futures.


Prix
Depuis le 24/02/2025
15
Ventes
1.83K
Installations gratuites