
Descripción
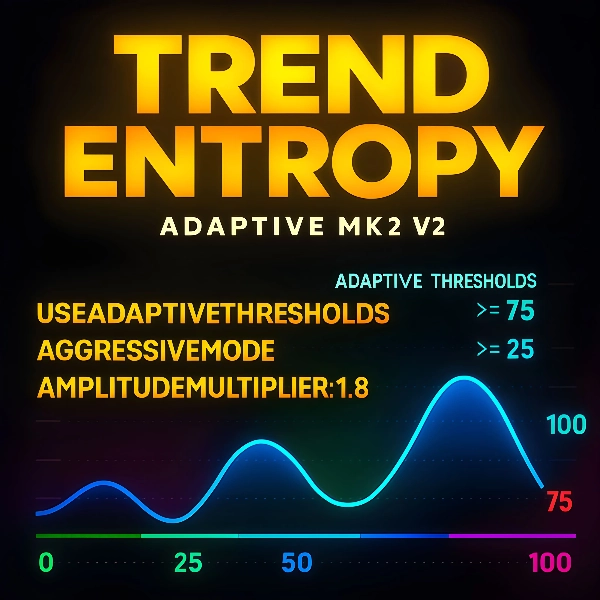
Trend Entropy – Indicador gratuito para cTrader
La entropía es la medida científica del desorden o la incertidumbre en un sistema. En física, muestra cómo se dispersa la energía y por qué los sistemas tienden hacia el caos. En la teoría de la información, mide la imprevisibilidad en los datos. Una entropía baja significa orden y previsibilidad, mientras que una entropía alta refleja aleatoriedad, complejidad y menor claridad en los resultados.
Descubra el poder del orden dentro del caos. Trend Entropy es un indicador técnico de vanguardia diseñado para medir la organización frente a la aleatoriedad de los movimientos de precios. A diferencia de los osciladores tradicionales que solo rastrean el impulso o la volatilidad, Trend Entropy aplica cálculos avanzados de entropía para revelar si el mercado está siguiendo una tendencia estructurada o derivando hacia un comportamiento caótico y lateral.
Esta herramienta gratuita está diseñada para traders que desean una visión más profunda de la dinámica oculta de la acción del precio. Al combinar la entropía estadística con un suavizado al estilo RSI y umbrales adaptativos, Trend Entropy transforma la volatilidad bruta en una escala clara y normalizada del 0% al 100%. El resultado es una línea única y elegante que indica si el mercado está en una tendencia fuerte, una consolidación neutral o un rango volátil.
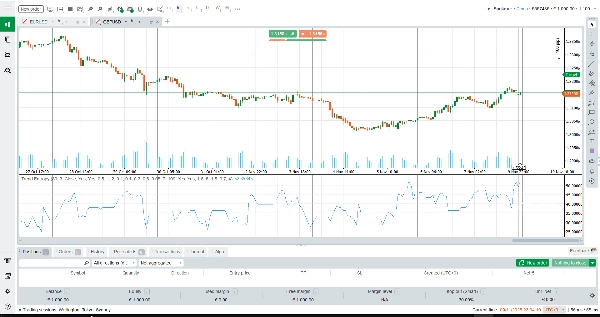
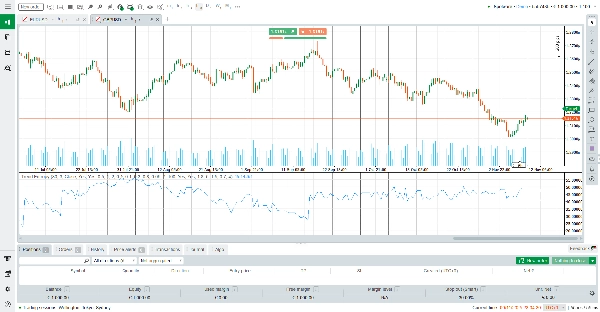
Cómo leer Trend Entropy
Valores bajos (0–33%): El mercado está organizado. Si el rendimiento promedio es positivo, sugiere una probable tendencia alcista. Si es negativo, indica una probable tendencia bajista.
Valores medios (34–66%): Territorio neutral. El mercado puede estar consolidándose, con una ligera inclinación hacia alcista o bajista según el rendimiento medio.
Valores altos (67–100%): El caos domina. La acción del precio está en rango, es impredecible y menos fiable para estrategias de seguimiento de tendencia.
Las líneas de referencia horizontales en 25%, 50% y 75% facilitan la interpretación. Los traders pueden ver instantáneamente si la entropía se está comprimiendo hacia el orden o expandiendo hacia el caos.
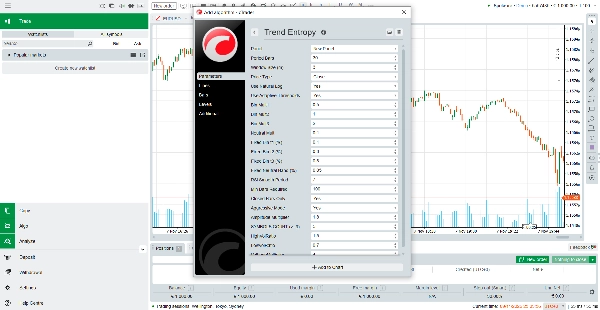
Cómo funciona el indicador
Trend Entropy calcula los rendimientos durante un período elegido y los mapea en estados simbólicos. Estos estados se analizan en ventanas superpuestas para construir una distribución de frecuencias de patrones de precios. Usando matemáticas de entropía, el indicador mide el grado de desorden en estas secuencias.
Para hacer la salida práctica, la entropía bruta se normaliza a una escala porcentual y luego se suaviza usando un método de promediado al estilo Wilder. Los umbrales adaptativos aseguran que el indicador se ajuste a la volatilidad actual, mientras que el modo agresivo amplifica las señales para traders que prefieren respuestas más rápidas. Finalmente, se aplican ratios de volatilidad para refinar la lectura, elevando los valores en condiciones caóticas y reduciéndolos en condiciones estables.
El resultado final es una única línea suavizada que captura la esencia de la estructura del mercado: si el precio está siguiendo una tendencia con orden o derivando hacia la aleatoriedad.
Características clave
Análisis basado en entropía – Va más allá del impulso para medir la verdadera organización de la acción del precio.
Umbrales adaptativos – Se ajusta automáticamente a la volatilidad, manteniendo las señales relevantes en todas las condiciones del mercado.
Suavizado al estilo RSI – Proporciona una línea limpia y estable que evita fluctuaciones ruidosas.
Integración de volatilidad – Mejora la precisión comparando ratios de volatilidad a corto y largo plazo.
Diseño visual claro – Niveles de referencia horizontales y una única línea DodgerBlue facilitan la interpretación.
¿Por qué elegir Trend Entropy?
Trend Entropy no es solo otro oscilador. Es una herramienta híbrida que combina rigor estadístico con una visualización amigable para el trader. Ya sea que seas un seguidor de tendencias buscando confirmación, o un trader de rango que busca evitar mercados caóticos, este indicador te brinda la claridad que necesitas.
Resumen
The indicator outputs a single smoothed line on a normalized scale from 0% to 100%, where low values (0–33%) indicate organized trending markets, mid values (34–66%) suggest neutral or consolidating conditions, and high values (67–100%) reflect chaotic, ranging markets. Horizontal reference lines at 25%, 50%, and 75% aid interpretation.
Trend Entropy pro incorporates RSI-style smoothing, adaptive thresholds that adjust to current volatility, and volatility ratio integration to enhance signal accuracy. It is designed to provide traders with deeper insight into market dynamics beyond traditional momentum or volatility indicators, supporting analysis across various markets including Forex, cryptocurrencies, commodities, indices, and stocks.
This indicator is suitable for traders seeking to identify trending versus ranging conditions and improve decision-making in trend-following or range-trading strategies.


