説明
ORセッションゾーン — マルチセッションオープニングレンジインジケーター
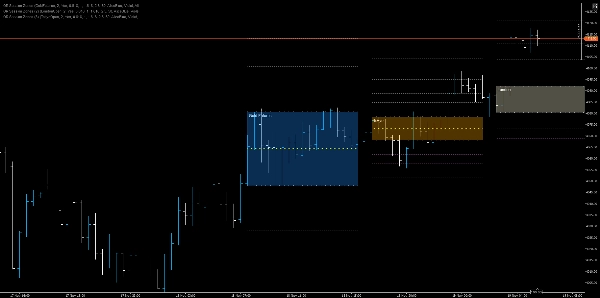
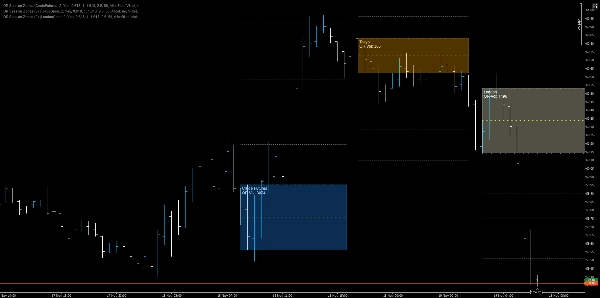
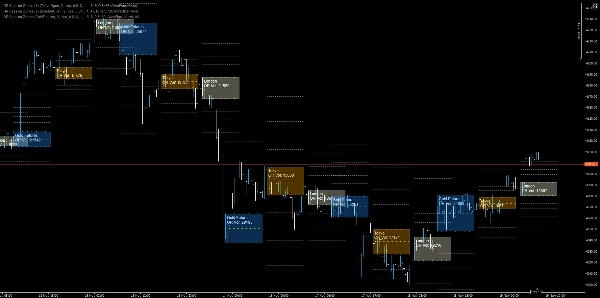
高精度のオープニングレンジインジケーターで、セッションの開始(NY、ロンドン、EU、東京、上海、金/原油先物)を検出し、動的なORの高値/安値/中間ゾーンを描画し、フィボナッチベースのターゲットを予測し、迅速な視覚的判断のために設定可能なシェードエリアを描画します。
主な特徴
- マルチセッション検出:専用のセッションインジケーターを使用して、ニューヨーク、ロンドン、ユーロネクスト、東京、上海、金先物、原油先物のオープニングバーをネイティブサポート。
- オープニングレンジ計算:設定可能なキャンドル数(RangeCandles)からORの高値と安値を計算し、セッション開始時間を記録。
- 持続的なチャートオーバーレイ:設定可能な延長時間までチャート全体にORの高値、安値、中間(50%)のトレンドラインを描画。
- シェードゾーン:ORの高値と安値の間に塗りつぶされた長方形を描画し、セッションごとに設定可能な不透明度と色で即座に視覚的なコンテキストを提供。
- フィボナッチ予測:ORレンジから導出された最大4本のR(レジスタンス)およびS(サポート)予測ラインを独立した色と調整可能な不透明度で表示。
- 柔軟な表示設定:衝突を防ぐためにインデックス付き(ユニーク)オブジェクトIDを非表示またはレンダリングするオプション;非表示が切り替えられた場合、単一の持続オブジェクトとバーごとのオブジェクトの両方をサポート。
- セッションカラーコーディング:各セッションは異なるカラースキーム(例:DodgerBlue、LightYellow、Orange、OrangeRed)を使用し、セッションの起源を即座に識別可能に。
トレーダーへの利点
- 迅速なコンテキスト:主要セッションの市場開始位置を即座に把握し、手動測定なしで初期のレンジ構造を理解。
- 意思決定トリガー:ORのブレイク、中間線の反発、フィボナッチ予測をエントリー/エグジットルールやストップ配置の基準として使用。
- マルチセッション戦略:重複するOR(例:ロンドン+NY)を組み合わせてセッションの合流ゾーンや高確率の取引エリアを検出。
- リスク管理:ORスタックの背後にストップを置くか、中間の50%を動的なストップ/テイクターゲットとして使用。
使用シナリオと例示ルール
- ブレイクアウトエントリー:ボリュームやモメンタムの確認を伴い、ORの高値を終値で上回ったら買い;ストップはORの高値のすぐ下(またはよりタイトなエグジットの場合はORの中間)。
- オープンのフェード:価格がORの中間を維持できず、急速な買い注文の引き下げを示した場合、反転確認を伴いORの高値付近でショート。
- セッション合流トレード:ロンドンとNYのORが重なる場合、その重なりを高信頼の供給/需要ゾーンとして扱い、ポジションサイズを調整。
- 予測ターゲット:R1/R2/R3/R4を段階的な利食いレベルとして使用し、S1 - S4を対称的に下落ターゲットとして使用。
概要
インジケーターのプロフィール
カスタマーレビュー
4.5
レビュー: 2
5 | 50 % | |
4 | 50 % | |
3 | 0 % | |
2 | 0 % | |
1 | 0 % |
カスタマーレビュー
November 22, 2025
Solid enough as a backup opinion, and It can look better than it is during a lucky run.
November 19, 2025
ディスカッション
よくあるご質問
Fibonacci
Forex
Breakout
Indices
EURUSD
Commodities
GBPUSD
XAUUSD
NAS100
cTrader Storeで入手可能な取引ボット、インジケーター、プラグインなどの商品は、第三者の開発者が提供するものであり、情報と技術の取得のみを目的としてご利用いただけます。cTrader Storeはブローカーではなく、投資助言や個人的な推奨を行うことも、将来のパフォーマンスを保証することもありません。


価格
26
販売
2.15K
無料インストール