説明
📈 スキュー・ボラティリティ・バイアス・インジケーター – プロフェッショナル版(cTrader用)
市場の圧力、ボラティリティの不均衡、方向性の確信をより深く理解するために、スキュー・ボラティリティ・バイアス・インジケーターを活用してください。これは、Pine Scriptに触発されたクラシックなボラティリティベースのアプローチの強化版で、現在は完全にcTrader向けに最適化されています。
このツールはトレーダーがどちらの市場側がより強く影響を与えているか—買い手か売り手か—をボラティリティの非対称性を測定し、それを明確で読みやすいシグナルに変換することで視覚化するのに役立ちます。
インデックス、外国為替、商品、暗号通貨のいずれを取引していても、このインジケーターは強力なトレンドフィルター、レジーム検出器、バイアス確認ツールとして機能します。
1. スキュー・インジケーターが測定するもの
このインジケーターはボラティリティのバランスを強気と弱気のローソク足間で評価します。
正規化されたTrue Rangeを計算し、それを2つの適応平均に入力します:
- Deviation Max → 上昇ローソク足中に発生するボラティリティ
- Deviation Min → 下降ローソク足中に発生するボラティリティ
次に以下を計算します:
👉 Skew = DeviationMax / DeviationMin
これにより、生のボラティリティが明確な方向性の読み取りに変換されます:
- Skew > 1 → 平均して上昇の動きが強い
- Skew < 1 → 下落の動きが強い
- Skew ≈ 1 → ボラティリティは対称的で市場は均衡している
要するに:
スキューはどちらの側が「ボラティリティの支配」を持っているかを明らかにします。
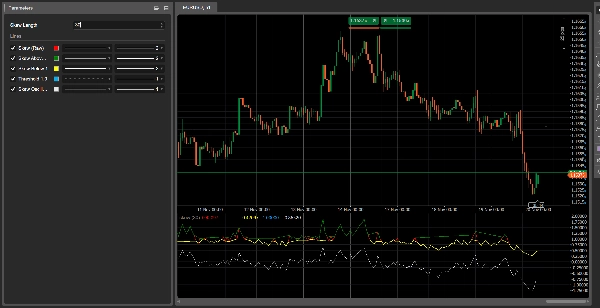
2. ラインの理解
1. スキュー(生データ) – 赤い線
純粋なボラティリティ比率。これがコアシグナルです。
2. スキュー 1以上 – 緑の線
強気のボラティリティ支配を示します。
3. スキュー 1未満 – 黄色の線
弱気のボラティリティ支配を示します。
4. 閾値 1.0 ライン – 青の点線
均衡を表します。
5. スキュー・オシレーター(対数) – 白い線
より安定し、滑らかな表現:
- 0以上 = 強気のボラティリティ
- 0未満 = 弱気のボラティリティ
3. 読み方
A) 市場レジーム
🔹 強気レジーム
- Skew > 1
- 緑の線がアクティブ
- オシレーターがゼロ以上
→ 市場はロングを支持しています。
🔹 弱気レジーム
- Skew < 1
- 黄色の線がアクティブ
- オシレーターがゼロ未満
→ 市場はショートを支持しています。
🔹 ニュートラル
- Skew ≈ 1
→ 市場は均衡しており、レンジ取引に適しています。
4. レジームシフトシグナル
Skewが1を上回るクロス
→ 買い手がボラティリティ支配を獲得
→ 強気への移行
Skewが1を下回るクロス
→ 売り手がボラティリティ支配を獲得
→ 弱気への移行
これらのシフトはしばしば価格変動がトレンドを確認する前に発生し、スキューは強力な早期指標となります。
5. 実用的な使用例
1️⃣ cBots用トレンドフィルター
- SkewOsc > 0 の時のみロング取引
- SkewOsc < 0 の時のみショート取引
2️⃣ トレンドの質の確認
- 上昇トレンド + Skew > 1 = 強いトレンド
- 上昇トレンド + Skewが1に向かって下落 = トレンドの弱まり
3️⃣ 市場センチメント / リスクフィルター
特にインデックスや主要FX通貨ペアで効果的です。
6. まとめ
- 示すもの: ボラティリティの支配
- 重要な理由: ボラティリティの変化は価格変動に先行する
- 使い方: フィルター、確認ツール、またはセンチメントの指標として
- 最大の利点: 非常に軽量で高速、かつ適応性が高い
概要
カスタマーレビュー
5 | 67 % | |
4 | 33 % | |
3 | 0 % | |
2 | 0 % | |
1 | 0 % |


