AbsorptionRatio_AutoRiskPanel
インジケーター
バージョン 1.0、Dec 2025
Windows、Mac
5.0
レビュー: 1
説明
AbsorptionRatio_AutoRiskPanel は任意の cTrader シンボルをライブの リスクレジームダッシュボード 🛰️ に変換します。
元のマルチアセット Absorption Ratio のように複数の ETF に依存する代わりに、このインジケーターは取引している銘柄の価格動作から直接 単一シンボルの AR 代理指標 を構築します:
- 📉 現在のシンボルの 対数リターン を計算します。
- 🔗 複数のラグ(1~7バー、相関期間に応じて)にわたる リターンの自己相関 を測定します。
- 📊 平均絶対自己相関 を集計し、0.5から1.0の間で正規化された Absorption Ratio にマッピングします — 値が高いほど集中度が高く、挙動がタイトになります。
- 🧬 生の信号を EMA で平滑化し、安定した AR 曲線を生成します。
- 🧪 ローリングの 統計的ルックバック にわたり、以下を計算します:
-
- AR の 平均 と 標準偏差
- 現在の Zスコア(平均からの標準偏差の数)
- 今日の AR と過去の パーセンタイルランク
- 🤖 Auto Thresholds が有効な場合、インジケーターは継続的に リスクレベルを自己校正 します:
-
- 低リスク ≈
平均 − 0.5σ - 高リスク ≈
平均 + 0.5σ - 極端リスク ≈
平均 + 1.5σ
値は[0…1]にクランプされ、バーごとに更新されるため、レジームは各シンボルと時間枠に適応します。
- 低リスク ≈
- 🧱 これらの閾値から、AbsorptionRatio_AutoRiskPanel は4つの動的レジームを定義します:
-
- LOW → 分散していて穏やか / リスクオン環境
- NORMAL → バランスの取れた / 中立的な状態
- HIGH → クラスタリングが高まり、リスクオフ傾向
- EXTREME → ストレスのかかった環境、潜在的なシステミックリスクの急増 🛑
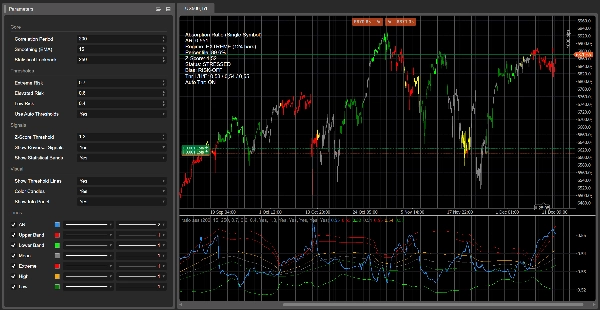
- 🕯️ メインチャート上で、ローソク足は リスク別に色分け できます:
これにより即座に 視覚的フィルター が得られます:例えば、ローソク足が赤やオレンジでないときだけトレンドエントリーを行う、またはストレスのかかったレジーム時にポジションサイズを縮小するなど。 -
- 🔴 赤 → AR が統計的にストレス状態(Zスコア ≥ 閾値)
- 🟢 ライム → AR が統計的に落ち着いている(Zスコア ≤ −閾値)
- 🟧 / 🟡 オレンジ/黄色 → 高リスク以上 / 極端リスク付近
- ⚪ グレー → 中立ゾーン
- 💚 緑 → 低 AR、より分散した / リスクオンの挙動
- 🎯 AR パネル内のオプションの 平均回帰シグナル:
-
- 🟢 買い矢印 は AR が統計的に落ち着いて上昇し始めたときに表示されます
- 🔴 売り矢印 は AR が統計的にストレス状態で下降し始めたときに表示されます
- 📋 左上隅のコンパクトな 情報パネル は以下を表示します:
-
- 現在の AR 値
- アクティブな レジーム とその継続時間(このレジームに費やしたバー数)
- パーセンタイル、Zスコア と定性的な ステータス(STRESSED / CALM / NORMAL)
- リスクの バイアス(RISK-ON / RISK-OFF / NEUTRAL)
- 使用されている実際の 低 / 高 / 極端閾値 と Auto Thresholds のオン・オフ状態
以下の目的で AbsorptionRatio_AutoRiskPanel を使用してください:
- 統計的にストレスのかかったリスクオフレジーム中の取引を避ける
- ブレイクアウトやトレンドフォローがより効果的に機能する 落ち着いた環境 を識別する
- 固定のボラティリティフィルターを使う代わりに、動的リスクレジームフレームワーク 内で任意の戦略を文脈化する
⚙️ パラメーター(ストアドキュメント)
コア ⚙️
- 相関期間 – 自己相関ウィンドウの長さ。Absorption Ratio を推定するために使用される履歴の量を制御します。値が大きいほど滑らかで「マクロ」なレジーム、小さいほど速くてノイズが多くなります。
- 平滑化(EMA) – 生の AR 信号に適用される EMA 期間。値が高いほどレジーム変化が滑らかになり、低いほどインジケーターがより反応的になります。
- 統計的ルックバック – AR の平均、標準偏差、Zスコア、パーセンタイルのルックバック期間。統計的ベースラインの適応速度を制御します。
閾値 🚦
- 極端リスク / 高リスク / 低リスク – Auto Thresholds がオフのときに使用される AR レジーム(LOW / NORMAL / HIGH / EXTREME)の手動閾値。Auto がオンの場合はロジックに無視され、デフォルトとしてのみ表示されます。
- Auto Thresholds を使用 – オンの場合、閾値はローリング AR 統計から導出されます:
-
- 低リスク = 平均 − 0.5σ
- 高リスク = 平均 + 0.5σ
- 極端リスク = 平均 + 1.5σ
シグナル 🎯
- Zスコア閾値 – AR を統計的に極端と分類するための最小絶対 Zスコア。STRESSED/CALM ラベル、ローソク足の上書き、平均回帰矢印を駆動します。
- 反転シグナルを表示 – AR サブウィンドウ内の買い/売り矢印の有効化/無効化。
- 統計バンドを表示 – AR 周囲の ±2σ バンドと平均線の切り替え。
ビジュアル 🎨
- 閾値ラインを表示 – レジームエンジンで使用される実際の低 / 高 / 極端レベルを表示(手動または自動)。
- ローソク足の色付け – Zスコアとレジームレベルに応じて価格ローソク足に色を付け、即時のリスク可視化を実現。
- 情報パネルを表示 – 左上隅に AR、レジーム、統計、バイアスを表示するテキストパネル。
概要
インジケーターのプロフィール
カスタマーレビュー
5.0
レビュー: 1
5 | 100 % | |
4 | 0 % | |
3 | 0 % | |
2 | 0 % | |
1 | 0 % |
カスタマーレビュー
December 20, 2025
the cleanest use is it makes weak ideas easier to leave alone, and It should stay in the support stack.
ディスカッション
よくあるご質問
Signal
Indices
Commodities
GBPUSD
RSI
Bollinger
Fibonacci
Scalping
AI
XAUUSD
NAS100
MACD
BTCUSD
Forex
Breakout
EURUSD
NZDUSD
Martingale
Prop
ZigZag
Supertrend
Fair Value Gap
SMC
Crypto
Grid
Stocks
ATR
USDJPY
VWAP
cTrader Storeで入手可能な取引ボット、インジケーター、プラグインなどの商品は、第三者の開発者が提供するものであり、情報と技術の取得のみを目的としてご利用いただけます。cTrader Storeはブローカーではなく、投資助言や個人的な推奨を行うことも、将来のパフォーマンスを保証することもありません。


これも好きかも


価格
42.11M
取引数量
6.13M
獲得pips
222
販売
8.39K
無料インストール