الوصف
🌟 انحدار فيبوناتشي الخطي🌟
مؤشر أشرطة انحدار فيبوناتشي هو أداة تقنية متقدمة تجمع بين قوة خطوط الانحدار ومستويات فيبوناتشي لتحديد الاتجاهات ومناطق الدعم/المقاومة ونقاط الانعكاس المحتملة في الأسواق المالية. 📈 يقدم هذا المؤشر منظورًا متعدد الأبعاد من خلال تحليل أطر زمنية متعددة في نفس الوقت (5 دقائق، 15 دقيقة، 30 دقيقة، و4 ساعات)، مما يسمح للمتداولين بتحديد مناطق التقاء بدقة أكبر. ⏳
🎯 ماذا يفعل المؤشر؟
ينشئ المؤشر قنوات انحدار بناءً على بيانات الأسعار التاريخية ويدمجها مع مستويات تصحيح فيبوناتشي، مما يوفر خريطة بصرية شاملة لمناطق السوق الرئيسية. من خلال تحليل أطر زمنية مختلفة، يقدم رؤية شاملة لسلوك السعر، يمزج بين الاتجاهات طويلة الأجل وحركة السعر قصيرة الأجل. 📊
🔍 المكونات الرئيسية
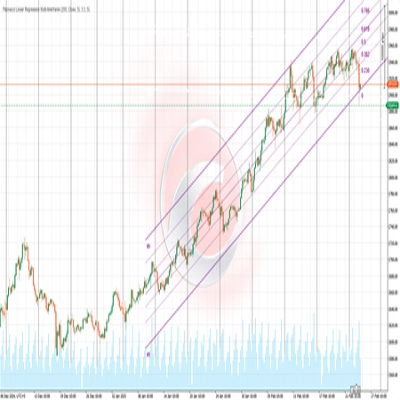
- قنوات الانحدار: يحسب المؤشر خطوط الانحدار الخطي على فترة يحددها المستخدم (الافتراضي: 200 شريط) لعرض الاتجاه العام للسعر. 📉📈
- أشرطة الانحراف: ترسم أشرطة علوية وسفلية حول خط الانحدار المركزي، تمثل الانحرافات الإحصائية عن السعر، مشابهة لأشرطة بولينجر ولكنها تعتمد على الانحدار الخطي. 📐
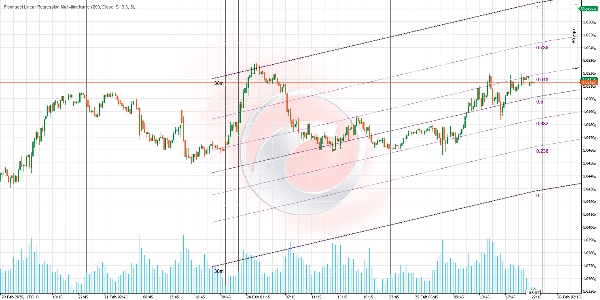
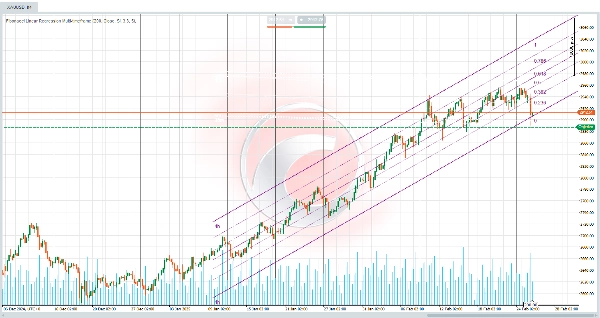
- مستويات فيبوناتشي: ترسم مستويات فيبوناتشي الكلاسيكية (0، 0.236، 0.382، 0.5، 0.618، 0.786، و1) داخل القناة، مما يوفر نقاط ارتداد أو استمرار محتملة. 🔢
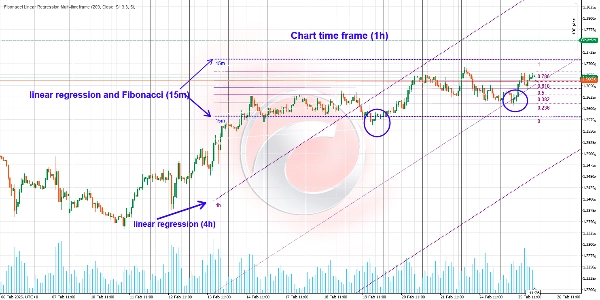
- تحليل متعدد الأطر الزمنية: تحليل متزامن لأطر زمنية 5 دقائق، 15 دقيقة، 30 دقيقة، و4 ساعات، كل منها ممثل بألوان مميزة، يساعد في تحديد المناطق التي تتوافق فيها أطر زمنية متعددة. 🎨
🔄 تحليل السوق متعدد الأبعاد
تتيح لك هذه الاستراتيجية رؤية السوق من زوايا متعددة، مدمجة الاتجاهات طويلة الأجل مع تحركات السعر قصيرة الأجل. تمكن هذه الطريقة من:
- تعديل الصفقات ديناميكيًا مع تطور السوق. 🔄
- التبديل بين الأطر الزمنية حسب الحاجة. ⏱️
- التقاط تحركات كبيرة ضمن الاتجاه الأساسي. 🚀
- استغلال التقلبات الصغيرة لتحسين نقاط الدخول والخروج. 🎯
🔄 التفاعل بين الأطر الزمنية
الإطار الزمني 4 ساعات مع قناة الانحدار
- يوفر رؤية للاتجاه السائد. 💪
- يقدم أساسًا قويًا لتقييم اتجاه السوق العام.
- في هذا السياق، يمكن تعطيل مستويات فيبوناتشي لتجنب الفوضى.
- التركيز يبقى على قناة الانحدار التي تظهر الاتجاه السائد.
الأطر الزمنية الأدنى مع الانحدار وفيبوناتشي
- تفعيل خطوط الانحدار ومستويات فيبوناتشي على أطر زمنية أقصر (5 دقائق، 15 دقيقة، أو 30 دقيقة).
- الحصول على إشارات أكثر دقة ضمن سياق الاتجاه الأوسع.
- تساعد مستويات فيبوناتشي في تحديد نقاط الدخول والخروج المحتملة ضمن الإطار الزمني الأكبر.
📊 كيفية تفسير النتائج
تحديد الاتجاهات
- اتجاه خط الانحدار المركزي يشير إلى الاتجاه السائد (صاعد، هابط، أو جانبي). 📈📉➡️
- ميل الخط يشير إلى قوة الاتجاه—الميل الأكثر حدة يدل على اتجاهات أقوى. 🔍
- تقارب خطوط الانحدار من أطر زمنية مختلفة في نفس الاتجاه يدل على اتجاه قوي وموثوق.
مناطق الدعم والمقاومة
- الأشرطة العلوية والسفلية تعمل كمناطق دعم ومقاومة ديناميكية. 🛡️
- مستويات فيبوناتشي داخل القناة توفر دعم/مقاومة إضافية، خاصة عند 0.618 و0.382.
- عندما تتوافق مستويات فيبوناتشي من أطر زمنية مختلفة، فإنها تخلق مناطق التقاء ذات احتمالية عالية.
🌐 تحديد مناطق التقاء
تحدث مناطق التقاء حيث تتداخل خطوط الانحدار ومستويات فيبوناتشي. تمثل هذه المناطق نقاطًا محتملة لتفاعل سعر مهم:
- عندما يتوافق تصحيح فيبوناتشي مع الحافة العلوية أو السفلية لقناة الانحدار، فإنه يعمل كنقطة دعم أو مقاومة قوية.
- عندما تتقاطع أو تتقارب خطوط الانحدار من أطر زمنية مختلفة.
- عندما تتزامن مستويات فيبوناتشي من أطر زمنية متعددة في منطقة محددة.
- عندما يرتد السعر بدقة عند مستوى فيبوناتشي يتزامن مع خط قناة الانحدار.
🔄 تحديد مناطق الانعكاس
إذا اخترق السعر قناة الانحدار في إطار زمني أصغر واقترب من مستوى فيبوناتشي رئيسي، فقد يشير ذلك إلى انعكاس محتمل. تشمل علامات الانعكاس الإضافية:
- التمدد الزائد: عندما يصل السعر إلى أو يتجاوز الشريط العلوي/السفلي، خاصة عند التوافق مع مستويات فيبوناتشي عبر أطر زمنية متعددة.
- التباعد مع مؤشرات الزخم: استخدام هذا المؤشر مع RSI أو MACD أو غيرها يمكن أن يعزز اكتشاف التباعد.
- اختراق الخط المركزي: عبور خط الانحدار المركزي قد يشير إلى تغير في ديناميكيات السعر، خصوصًا إذا حدث عبر أطر زمنية متعددة في نفس الوقت.
🧩 تعدد السيناريوهات
استخدام مجموعات مختلفة من قنوات الانحدار ومستويات فيبوناتشي عبر أطر زمنية متعددة يمكن أن يخلق سيناريوهات تداول متنوعة:
- الحفاظ على مركز شراء في الإطار الزمني 4 ساعات مع التداول في نفس الوقت على أطر زمنية أصغر للاستفادة من ارتدادات فيبوناتشي.
- تحديد الاتجاه الأساسي باستخدام قناة الانحدار 4 ساعات والعثور على نقاط دخول مثالية أثناء التصحيحات إلى مستويات فيبوناتشي في الأطر الزمنية الأصغر.
- استخدام التقاءات عبر أطر زمنية متعددة لتأكيد نقاط دخول وخروج ذات احتمالية عالية.
📈 استراتيجيات التداول
استراتيجية الانعكاس
- تحديد المناطق التي تتقارب فيها مستويات فيبوناتشي والأشرطة من أطر زمنية مختلفة.
- انتظار تأكيد السعر (أنماط الشموع، التباعد، إلخ).
- الدخول عكس الاتجاه السابق مع وقف خسارة ضيق.
- تحديد الأهداف عند المستوى التالي من فيبوناتشي أو خط الانحدار المركزي.
استراتيجية الاستمرار
- البحث عن تصحيحات إلى الخط المركزي أو مستويات فيبوناتشي الرئيسية (0.382 أو 0.618).
- تأكيد بقاء الاتجاه العام سليمًا عبر أطر زمنية متعددة.
- الدخول في اتجاه الاتجاه عندما يرتد السعر من هذه المستويات.
- وضع وقف خسارة أسفل/أعلى مستوى فيبوناتشي ذي الصلة.
من خلال الاستفادة من مؤشر انحدار فيبوناتشي الخطي، يمكن للمتداولين الحصول على رؤى أعمق في ديناميكيات السوق واتخاذ قرارات تداول أكثر وعيًا. كن حذرًا وتداول بذكاء! 💻📈
مؤشرات متجر Ctrader:
هيكل السوق الديناميكي
تحليل نقاط التحول
انحدار فيبوناتشي الخطي
تحليل متعدد الأطر الزمنية
تتبع ميل الشمعة متعدد المستويات
المتعقب
الملخص
This indicator performs simultaneous analysis across multiple timeframes—5-minute, 15-minute, 30-minute, and 4-hour—each displayed in distinct colors to identify confluence zones where signals from different timeframes align. The 4-hour timeframe focuses on the dominant trend using regression channels, while shorter timeframes include Fibonacci levels for precise entry and exit signals.
Traders can interpret the slope and direction of regression lines to assess trend strength and direction. Upper and lower bands act as dynamic support and resistance, with Fibonacci levels providing additional key zones. Confluence of regression lines and Fibonacci levels across timeframes highlights high-probability reaction points. The indicator supports reversal and continuation strategies by identifying key zones and confirming price action with multi-timeframe context.
تقييمات العملاء
5 | 100 % | |
4 | 0 % | |
3 | 0 % | |
2 | 0 % | |
1 | 0 % |


