
Quantitative Qualitative Estimation
インジケーター
203 ダウンロード数
バージョン 1.0、Dec 2024
Windows、Mac
5.0
レビュー: 1
説明
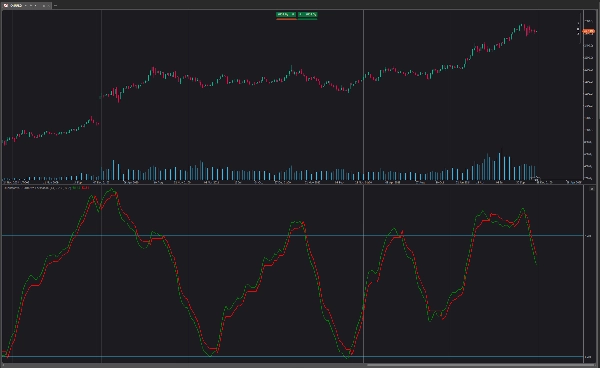
QQE(Quantitative Qualitative Estimation)加重オシレーターは、トレーリングストップによる指示に基づいてRSIを加重することで元のバージョンを改良しており、トレーリングストップとのクロスが発生するためにはより多くの努力が必要となります。QQE加重オシレーターは、平滑化されたRSIオシレーターと、この同じRSIから導出されたトレーリングストップで構成されています。
このオシレーターは、市場が買われ過ぎ/売られ過ぎかどうかを示すだけでなく、RSIの先行性のおかげでトレンド反転の早期指標としても使用できます。
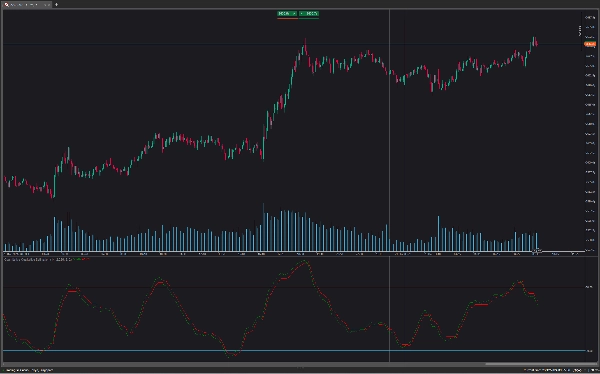
より高い Factor の値を使用すると、より長期のトレーリングストップが返されます。
通常のRSIと同様に、ダイバージェンスは反転の兆候となることがあります。
さらなる加重は、トレーリングストップがRSIをクロスするために必要な「努力」の度合いを制御します。例えば、トレーリングストップを上回るRSIは、より高い加重を使用した場合に潜在的なクロスが発生するためには、より大きな負の価格変動が必要となります。
これにより、より高い加重はより周期的で滑らかな結果をもたらすことがあります。
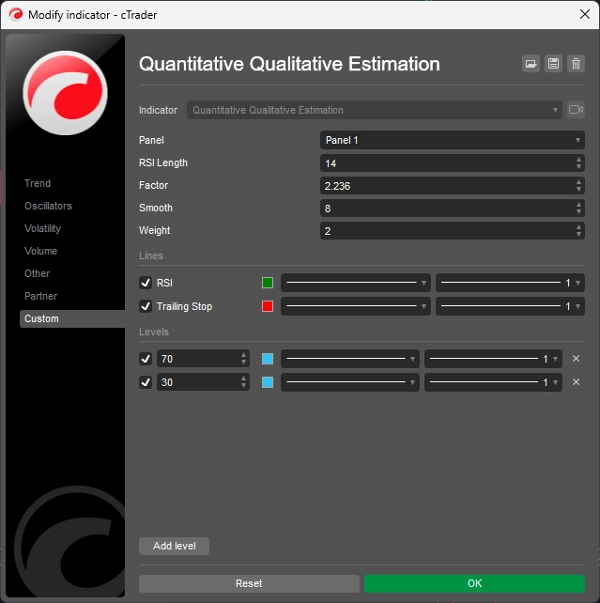
設定の変更方法:
- Length: RSIオシレーターの期間。
- Factor: トレーリングストップ計算に使用される乗数係数。
- Smooth: RSIオシレーターの平滑度の度合い。
- Weight: RSI計算に使用される加重の度合い。
概要
AIによる概要
The Quantitative Qualitative Estimation (QQE) Weighted Oscillator is an advanced technical indicator that enhances the traditional RSI by applying a weighting mechanism influenced by a trailing stop derived from the RSI itself. This design requires greater "effort" for the RSI to cross the trailing stop, potentially filtering out weaker signals. The indicator consists of a smoothed RSI oscillator paired with its trailing stop, enabling it to identify overbought or oversold market conditions and provide early signals of trend reversals due to the leading characteristics of the RSI. Users can adjust key parameters including Length (RSI period), Factor (multiplicative factor for trailing stop calculation), Smooth (degree of RSI smoothing), and Weight (degree of RSI weighting). Higher Factor values produce longer-term trailing stops, while increased Weight values demand stronger price movements to trigger crosses, resulting in smoother and more cyclical oscillator behavior. Like standard RSI, divergence between price and the oscillator may indicate potential reversals. This indicator is categorized under momentum indicators and is primarily based on the Relative Strength Index methodology.
インジケーターのプロフィール
カスタマーレビュー
5.0
レビュー: 1
5 | 100 % | |
4 | 0 % | |
3 | 0 % | |
2 | 0 % | |
1 | 0 % |
カスタマーレビュー
August 18, 2025
Smooth RSI-based signals, detects trend and reversals, customizable settings. Cons: No alerts, no MTF mode, no built-in strategy templates.
ディスカッション
よくあるご質問
RSI
cTrader Storeで入手可能な取引ボット、インジケーター、プラグインなどの商品は、第三者の開発者が提供するものであり、情報と技術の取得のみを目的としてご利用いただけます。cTrader Storeはブローカーではなく、投資助言や個人的な推奨を行うことも、将来のパフォーマンスを保証することもありません。


価格
2
販売
6.9K
無料インストール