
On Balance Volume
Indicatore
247 download
Versione 1.0, Dec 2024
Windows, Mac
5.0
Recensioni: 1
Descrizione
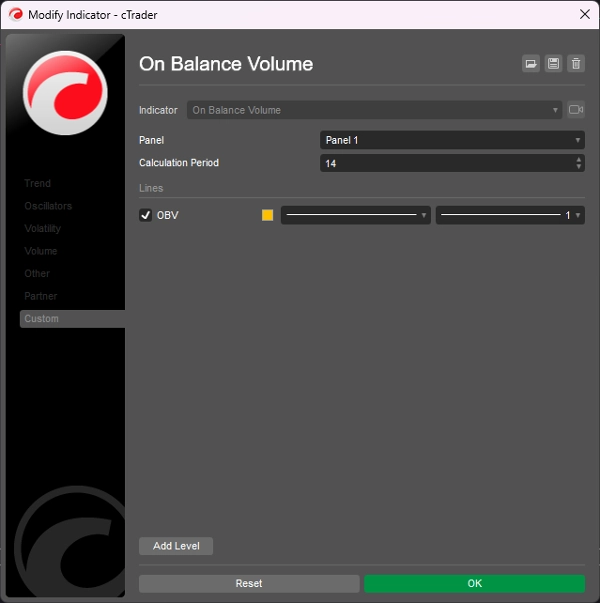
On Balance Volume (OBV) misura la pressione di acquisto e vendita come indicatore cumulativo che aggiunge il volume nei giorni in rialzo e sottrae il volume nei giorni in ribasso.
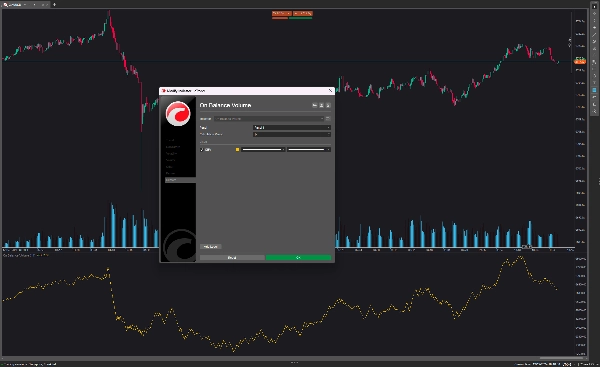
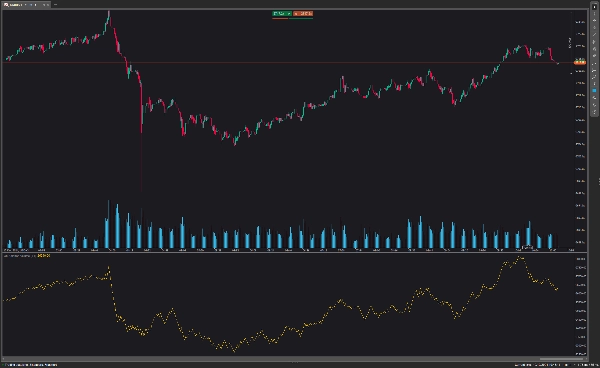
L'On Balance Volume è visualizzato nella parte inferiore del grafico. La linea OBV sale quando il prezzo di chiusura di oggi cresce e scende quando il prezzo di chiusura di ieri è superiore a quello attuale.
L'indicatore OBV generalmente identifica una rottura prima della linea del prezzo e aiuta a stabilire una chiara tendenza al rialzo. Se vuoi operare con questa strategia, apri una posizione forex al livello di prezzo di rottura e posizioni uno stop loss sopra l'ultimo massimo oscillante recente
Riepilogo
Riepilogo AI
On Balance Volume (OBV) is a technical indicator that measures buying and selling pressure by cumulatively adding volume on days when the closing price rises and subtracting volume on days when it falls. Displayed at the bottom of the chart, the OBV line moves upward when today's closing price exceeds the previous day's and moves downward when it is lower. This indicator is used to identify potential breakouts ahead of price movements and to confirm upward trends. Traders using OBV may open positions at breakout price levels and set stop losses above recent high swings. The indicator is applicable in forex markets and supports breakout trading strategies.
Profilo indicatore
Recensioni dei clienti
5.0
Recensioni: 1
5 | 100 % | |
4 | 0 % | |
3 | 0 % | |
2 | 0 % | |
1 | 0 % |
Recensioni dei clienti
August 18, 2025
Pros: A lightweight cumulative volume indicator that confirms price moves and detects divergences. Excellent for analyzing trend strength and sentiment. Cons: No alerts, tooltips, or template features. Signals may lag in volatile or manipulated markets.
Discussioni
Domande frequenti
Forex
Breakout
I prodotti disponibili tramite cTrader Store, inclusi bot di trading, indicatori e plugin, sono forniti da sviluppatori terzi e resi disponibili esclusivamente a scopo informativo e di accesso tecnico. cTrader Store non è un broker e non fornisce consulenze in materia di investimento, raccomandazioni individualizzate o garanzie di risultati futuri.
Altro da questo autore


Prezzo
2
Vendite
6.9K
Installazioni gratuite