
説明
一目均衡表分析の包括的ガイド
歴史と背景
一目均衡表(または一目雲)は、1930年代後半に日本のジャーナリストである細田悟一によって開発されました。助手のチームと共に長年の研究とバックテストを経て、細田は1969年にその成果を発表しました。「一目均衡表」という名前は「一目で均衡を見るチャート」を意味し、トレーダーが市場の複数の側面を一目で迅速に評価できるように設計されたことを反映しています。
細田の革新は、コンピューター分析が利用可能になる何十年も前にこの複雑なシステムを手作業で計算して作り上げた点で注目に値します。一目均衡表の特徴は、その全体的なアプローチにあり、複数の時間軸と市場分析の次元を統合した統一的な枠組みを提供しています。
一目均衡表の五つの構成要素
一目均衡表は5つの異なる線で構成されており、それぞれが特定の洞察を提供します:
1. 転換線(Tenkan-sen)
- 計算方法: 過去9期間の最高値と最安値の平均
- 機能: 短期の市場モメンタムを表す
- 解釈: 動的なサポート/レジスタンスレベルおよびトレンド指標として機能する
2. 基準線(Kijun-sen)
- 計算方法: 過去26期間の最高値と最安値の平均
- 機能: 中期の市場モメンタムを表す
- 解釈: より強力なサポート/レジスタンスレベルとして機能し、トレーリングストップとしても利用可能
3. 先行スパンA(Senkou Span A)
- 計算方法: 転換線と基準線の平均を26期間先にプロット
- 機能: 雲(クモ)の先端を形成する
- 解釈: 予測されるサポート/レジスタンスレベル
4. 先行スパンB(Senkou Span B)
- 計算方法: 過去52期間の最高値と最安値の平均を26期間先にプロット
- 機能: 雲(クモ)の後端を形成する
- 解釈: 予測されるサポート/レジスタンスレベル
5. 遅行スパン(Chikou Span)
- 計算方法: 現在の終値を26期間前にプロット
- 機能: トレンドの確認と潜在的な反転の識別
- 解釈: 価格の上にある場合は強気、下にある場合は弱気
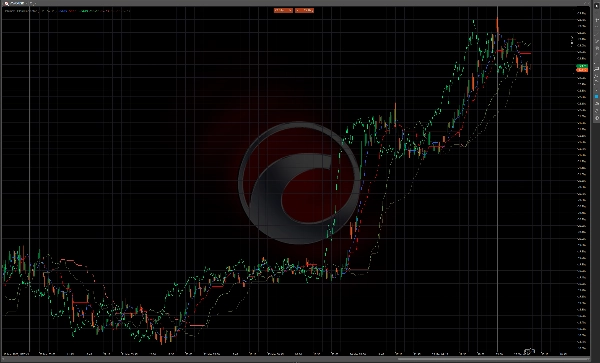
雲(クモ)
先行スパンAと先行スパンBの間の領域は「雲(クモ)」と呼ばれます。雲は潜在的なサポートおよびレジスタンスゾーンを表し、その厚さは市場のボラティリティとこれらのゾーンの強さを示します。
- 厚い雲: 強力なサポート/レジスタンス、高いボラティリティ
- 薄い雲: 弱いサポート/レジスタンス、低いボラティリティ
- 強気の雲: 先行スパンAが先行スパンBの上にある(通常は緑色)
- 弱気の雲: 先行スパンBが先行スパンAの上にある(通常は赤色)
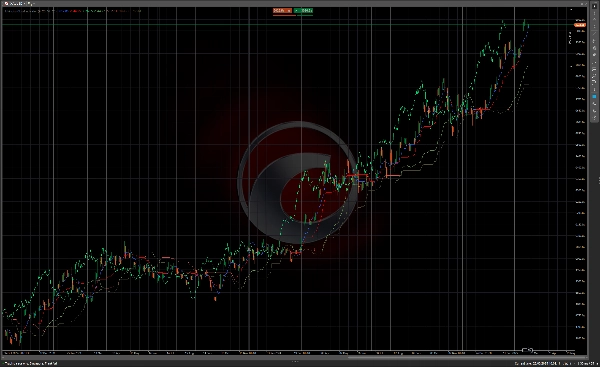
取引ルールとシグナル
トレンド判定
- 強気トレンドの条件:
-
- 価格が雲の上にある
- 転換線が基準線の上にある
- 遅行スパンが26期間前の価格の上にある
- 先行スパンAが上昇し、先行スパンBの上にある(強気の雲)
- 弱気トレンドの条件:
-
- 価格が雲の下にある
- 転換線が基準線の下にある
- 遅行スパンが26期間前の価格の下にある
- 先行スパンAが下降し、先行スパンBの下にある(弱気の雲)
- 中立/レンジ相場:
-
- 価格が雲の中にある
- 転換線と基準線が横ばいまたは頻繁に交差している
エントリーシグナル
強気のエントリーシグナル
- TKクロス(転換線/基準線クロス):
-
- 転換線が基準線を上抜ける
- 価格が雲の上にあるときに最も効果的
- 雲が強気の場合、より強いシグナル
- 雲ブレイクアウト:
-
- 価格が雲の下または中にあった後、上抜ける
- 先行する雲が強気(先行スパンA > 先行スパンB)の場合、より強いシグナル
- 遅行スパンの確認:
-
- 遅行スパンが26期間前の価格を上抜ける
- 遅行スパンの前方に抵抗がない
弱気のエントリーシグナル
- TKクロス(弱気):
-
- 転換線が基準線を下抜ける
- 価格が雲の下にあるときに最も効果的
- 雲が弱気の場合、より強いシグナル
- 雲ブレイクアウト(弱気):
-
- 価格が雲の上または中にあった後、下抜ける
- 先行する雲が弱気(先行スパンB > 先行スパンA)の場合、より強いシグナル
- 遅行スパンの確認(弱気):
-
- 遅行スパンが26期間前の価格を下抜ける
- 遅行スパンの前方にサポートがない
エグジットシグナル
- トレンド反転: 反対のトレンド条件が現れ始めたとき
- TKクロス: 転換線が基準線を逆方向にクロスしたとき
- 雲タッチ: 価格が雲の反対側に触れたとき
- 遅行スパン警告: 遅行スパンが過去の価格レベルに接近したとき
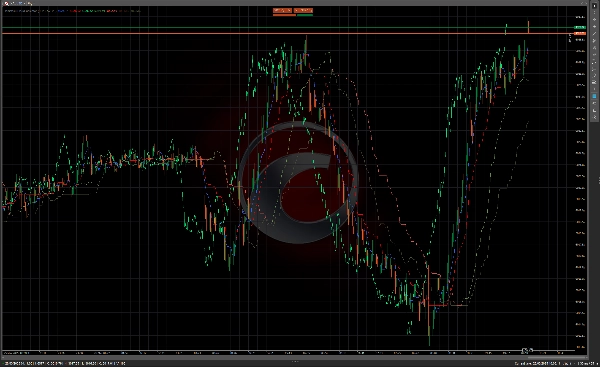
サポートおよびレジスタンスレベル
- 即時のサポート/レジスタンス: 転換線と基準線
- 中期のサポート/レジスタンス: 雲(平坦な部分でより強力)
- 雲のねじれ(Kumo Twist): 先行スパンAとBが交差し、潜在的な反転ポイントを形成
高度な一目均衡表テクニック
1. 雲のねじれ(Kumo Twist)
雲のねじれは、先行スパンAとBが交差し、26期間先の潜在的な反転ポイントを作る現象です。トレーダーはこれをトレンド変化の早期警告シグナルとしてよく利用します。
2. 時間軸分析
多くの一目均衡表トレーダーは複数の時間軸を分析します:
- 全体的なトレンド方向のための上位時間軸
- エントリーシグナルのための中間時間軸
- 正確なエントリータイミングのための下位時間軸
3. 先行スパンの拡大/縮小
- 拡大する雲: 市場のボラティリティ増加、トレンド強化
- 縮小する雲: ボラティリティ減少、トレンドの弱まりの可能性
4. 平坦な雲(Flat Kumo)
両方の先行スパンが平行に走るとき、それは明確なサポート/レジスタンスレベルを持つ強いトレンドを示すことが多いです。
実践的な応用
理想的な市場条件
一目均衡表はトレンド相場およびすべての時間軸で最も効果的に機能します。以下に適用可能です:
- 外国為替(Forex)
- 株式
- 商品
- 暗号通貨
- 指数
リスク管理
- 雲を動的なストップロスレベルとして使用する
- 雲の厚さに基づいてポジションサイズを調整する(厚い雲=高いボラティリティ)
- 強いトレンドでは基準線をトレーリングストップとして考慮する
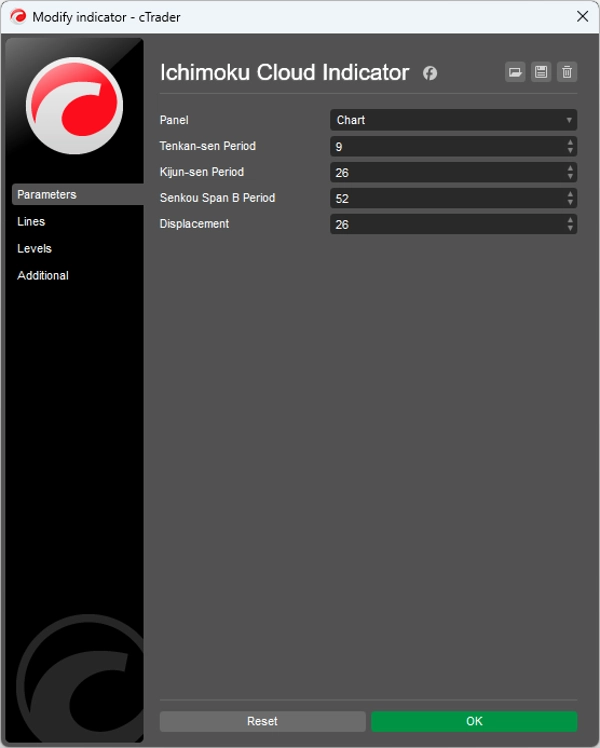
時間軸の互換性
伝統的な設定(9, 26, 52)は日本の6日間取引週に基づいているため、一部のトレーダーはこれらの設定を調整します:
- 日足チャート用に10, 30, 60
- より保守的なシグナル用に20, 60, 120
- 西洋市場(5日間取引週)用に7, 22, 44
結論
一目均衡表は、市場情報の複数の層を一つのビューで提供する包括的な取引システムを提供します。その強力さは単一のシグナルだけでなく、複数の指標が連携して機能することにあります。すべての構成要素が整うと、一目均衡表は明確なリスクパラメータを持つ高確率の取引機会を提供できます。
最初は複雑に見えますが、練習を重ねることで、細田が意図したようにトレーダーは「一目で」市場状況を評価できるようになります。このシステムの時間シフトされた構成要素は、市場の動態に対する独自の視点を提供し、トレーダーが将来の潜在的なサポートおよびレジスタンスレベルを事前に把握できるようにします。
概要
1. Tenkan-sen (Conversion Line): short-term momentum indicator and dynamic support/resistance.
2. Kijun-sen (Base Line): medium-term momentum indicator and stronger support/resistance, also used as a trailing stop.
3. Senkou Span A (Leading Span A): forms the leading edge of the cloud (Kumo), projected 26 periods ahead.
4. Senkou Span B (Leading Span B): forms the trailing edge of the cloud, projected 26 periods ahead.
5. Chikou Span (Lagging Span): current closing price plotted 26 periods back, confirming trends and potential reversals.
The cloud (Kumo), formed between Senkou Span A and B, represents support and resistance zones, with thickness indicating volatility and strength. The indicator provides trend determination, entry and exit signals, and support/resistance levels. It is applicable across various markets including Forex, stocks, commodities, cryptocurrencies, and indices, and works best in trending markets and multiple time frames. Risk management features include dynamic stop-loss levels based on the cloud and position sizing adjustments according to cloud thickness. Traditional settings are (9, 26, 52) periods, with common adjustments for different trading weeks.


