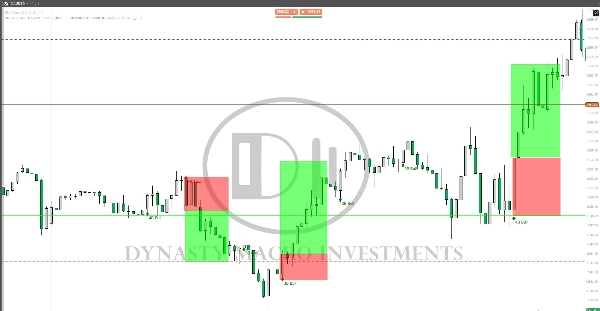
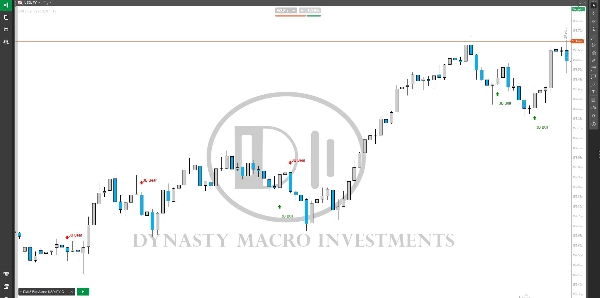
Morning Star On Chart
「Morning Star On Chart」ロゴ
03/09/2025
Desktop
Since 11/12/2024
「Morning Star On Chart」アップロード画像「Morning Star On Chart」アップロード画像

Morning Star pattern on chart (Bullish and Bearish) automatically marked with (BUY & SELL) Very powerful signals.

この作成者の他の商品
DMI 3 bar v2
Shows BUY & SELL signals for 3 & 4 BAR PATTERN (Morning star/ Evening star). It is adjustable and it will SHOW ARROWS.
DMI CUSTOM SESSIONS
This will allow you to have SESSIONS on the chart. London, New York, Asian session and you can customize the times.
DMI MONDAY ZONES v2.1
Marks Monday's OPEN,HIGH & LOW. These are areas of support and resistance for the week.
これも好きかも
インジケーター
Grid
NAS100
NZDUSD
+15
RangeBoxLevel
This technical analysis indicator provides information on market sentiment, trend and price levels....
インジケーター
XAUUSD
Commodities
Forex
+5
BullBear Dynamics
BullBear Dynamics helps traders detect and interpret the balance between bullish and bearish momentum
VegaXLR - Fibonacci Bands
Customizable Dynamic Fibonacci Channels and Smart Alerts
Vishal Volume Profile v2.0
Volume Profile plots traded volume at each price level, highlighting high activity zones of precise support & resistance
インジケーター
NAS100
RSI
NZDUSD
+16
AlphaTrend Pro Max
Turn data into precision trades with AlphaTrend Pro Max — advanced trend, signal & structure analysis in one.
VWAP
Track VWAP for Asia, London, NY, Sydney, Daily, Weekly, Monthly & Custom Sessions. Perfect for FX & intraday trading!
SessionPowerZonesPro
Highlights market sessions & overlaps with real-time range & volume stats – perfect for pro scalpers.
インジケーター
Indices
Prop
Commodities
+4
TrendPulse
BrickAlgo TrendPulse is an advanced technical analysis tool that combines multiple indicators with filterin mechanisms.
50 percent
This indicater is a magical impact which shows exactly high and low with 100% results
Open Trade PipsV1
This indicator tracks the unrealised amount of pips in your open positions.
Repiptor Candlescope Lite
Candlestick pattern detector lite version
インジケーター
RSI
Commodities
Signal
+1
Dot Momentum %BB Indicator
Dynamic circles visualize price's volatility position. Like RSI for market overextension & stretch. Quantify context.
インジケーター
Indices
Prop
Breakout
+3
RVI
A precision-crafted indicator that compares current volume to its historical average for the same time of day.
インジケーター
RSI
Breakout
XAUUSD
+7
Candle Strength Oscillator
The Candle Pressure Index is a powerful, user-friendly indicator that reveals hidden market pressure inside candles.
AlgoCorner 1-100 Moving Averages
Draw as many Moving Averages as you need from a simple indicator.
VGM - Auto Fibo Retracement
Auto Fibonacci Retracement Indicator.
Simple MACD Histogram
Simple MACD Histogram with color-coded rising (green) and falling (red) momentum bars.
インジケーター
NAS100
NZDUSD
XAUUSD
+7
Bayesian Price Projection Model
Bayesian theory** to forecast a future price while providing **uncertainty ranges** that represent upper and lower bound