CO ROBI
Przeciągany Średnia Krocząca kotwiczy średnią kroczącą do dowolnego punktu w historii cen — nie od paska zero, nie od stałego okresu, ale dokładnie tam, gdzie ją umieścisz.
Standardowe średnie kroczące zaczynają się od początku danych wykresu i z czasem zbliżają się do siebie. Ich okres jest stały. Ich punkt odniesienia jest arbitralny. Gdy chcesz zmierzyć, jak cena zmieniała się od konkretnego zdarzenia strukturalnego — rozpoczęcia korekty, początku impulsu, kluczowego wahnięcia — nie ma sposobu, aby zakotwiczyć ŚK do tego momentu.
Ten wskaźnik rozwiązuje ten problem.
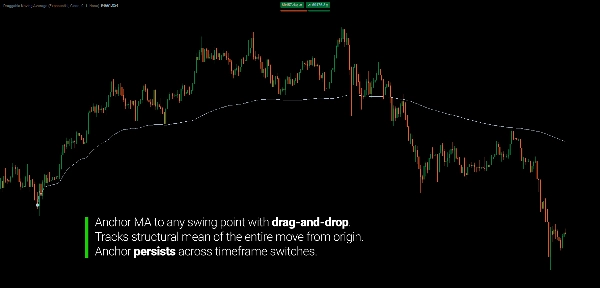
Umieść ikonę kotwicy na dowolnym pasku. ŚK zaczyna się od tego paska i rozciąga się do przodu. Przeciągnij ikonę na inny pasek — ŚK natychmiast przelicza się z nowej pozycji. Zmień interwały czasowe — kotwica pozostaje, ŚK automatycznie przelicza się na nowym wykresie.
Efektem jest średnia krocząca, która zawsze odzwierciedla, jak cena zmieniała się od określonego przez Ciebie punktu strukturalnego.
GŁÓWNA KORZYŚĆ
Standardowe podejście:
- Zidentyfikuj początek ruchu korekcyjnego lub impulsu
- Zastosuj ŚK o stałym okresie — zaczyna się od początku wykresu, nie od Twojej struktury
- Ręcznie dostosuj okres, aby przybliżyć długość struktury
- Zmień interwały czasowe — okres traci znaczenie przy różnej liczbie pasków
- Powtarzaj za każdym razem, gdy struktura się zmienia
Podejście z przeciąganą kotwicą:
- Umieść kotwicę na początku struktury
- ŚK oblicza się do przodu od tego dokładnego paska
- Zmień interwały czasowe — kotwica pozostaje, ŚK przelicza się automatycznie
- Przeciągnij, aby dostosować — wszystko aktualizuje się natychmiast
Różnica jest strukturalna. Zamiast przybliżać punkt odniesienia przez dostosowania okresu, definiujesz go bezpośrednio. Punkt strukturalny jest wejściem — nie okres.
KOTWICZONE DO STRUKTURY: WYKRYWANIE POWROTU DO ŚREDNIEJ I ODWRÓCENIA
Gdy średnia krocząca zaczyna się od punktu strukturalnego — początku trendu, startu impulsu lub rozpoczęcia korekty — przestaje być arbitralną linią wygładzającą i zaczyna zachowywać się jak średnia strukturalna.
Cena organizuje się wokół tej średniej w przewidywalny sposób:
- Podczas ruchu cena oscyluje wokół zakotwiczonej ŚK — oddalając się podczas wybuchów impetu, wracając do ŚK podczas konsolidacji. ŚK odzwierciedla średnią cenę całej struktury od jej początku, nie tylko ostatnich pasków.
- Przy wyczerpaniu cena zaczyna przecinać zakotwiczoną ŚK zamiast od niej odbijać. Zamknięcie poniżej rosnącej zakotwiczonej ŚK — która śledziła impuls od jego początku — ma znaczenie strukturalne. Naruszona jest średnia całego ruchu.
- Po odwróceniu zakotwiczona ŚK staje się oporem. Retesty ŚK od dołu oznaczają logiczne obszary, gdzie poprzednia średnia strukturalna działa jako podaż.
To zachowanie jest spójne, ponieważ ŚK mierzy właściwą rzecz: średnią cenę konkretnego ruchu strukturalnego od jego faktycznego punktu startowego, a nie od arbitralnego okresu wstecz.
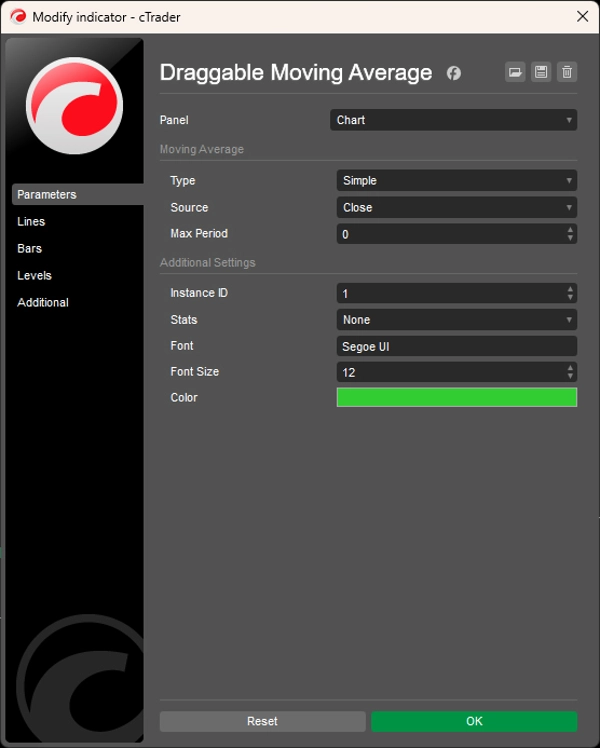
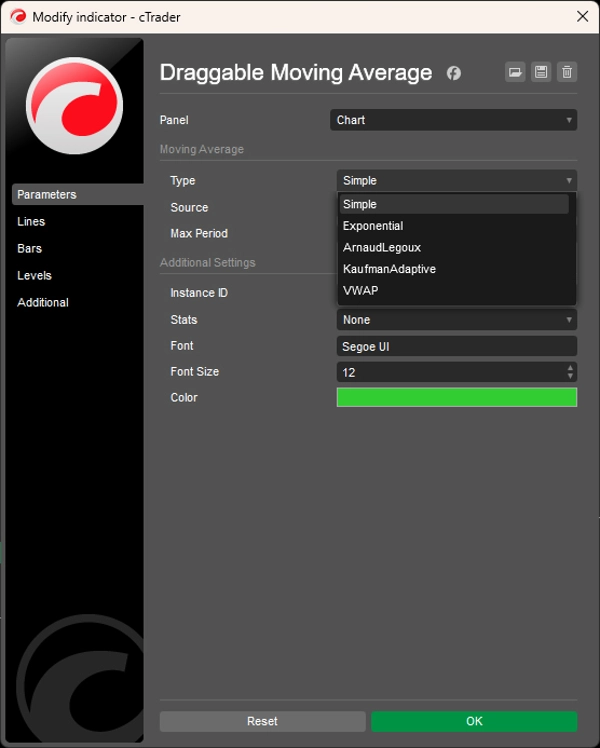
OBSŁUGIWANE TYPY ŚREDNICH KROCZĄCYCH
Pięć metod obliczeniowych, wybieranych dla każdej instancji:
- Prosta (SMA) — średnia arytmetyczna od kotwicy do przodu; rośnie z każdym paskiem aż do osiągnięcia Maksymalnego Okresu
- Wykładnicza (EMA) — ważona wykładniczo; bardziej reaguje na ostatnie ruchy cen
- Arnaud Legoux (ALMA) — ważona gaussowsko; redukuje opóźnienie bez wzmacniania szumu
- Kaufman Adaptive (KAMA) — dynamicznie dostosowuje wygładzanie na podstawie wskaźnika efektywności rynku; zwęża się podczas trendów, rozszerza podczas konsolidacji
- VWAP — średnia ważona wolumenem od kotwicy; odzwierciedla, gdzie od momentu punktu strukturalnego przeszła większość wolumenu
Wszystkie typy respektują Maksymalny Okres — ograniczają okno wstecz, zachowując kotwicę jako punkt odniesienia.
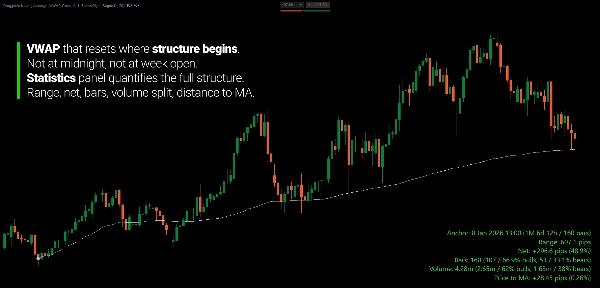
PANEL STATYSTYK
Opcjonalny panel nakładki, wybieralny w czterech narożnikach, wyświetla metryki w czasie rzeczywistym od kotwicy do bieżącego paska:
- Zakres w pipsach (najwyższy szczyt do najniższego dołka)
- Zmiana netto w pipsach i procentach
- Łączna liczba pasków z podziałem na bycze/niedźwiedzie i procentami
- Łączny wolumen z podziałem na byczy/niedźwiedzi i procentami
- Aktualna odległość ceny od ŚK w pipsach i procentach
- Czas trwania i licznik pasków od paska kotwicy do bieżącego paska
Przydatne do ilościowego określenia dokładnej struktury, do której się zakotwiczyłeś — nie tylko linii ŚK, ale pełnego profilu statystycznego ruchu cen od początku do teraz.
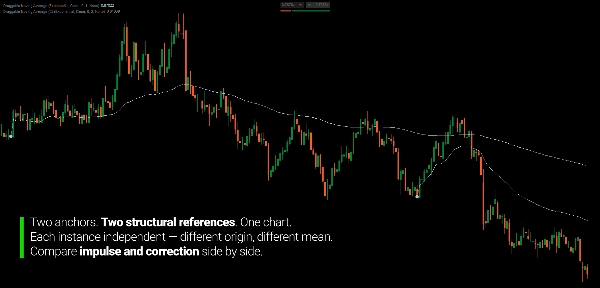
OBSŁUGA WIELU INSTANCJI
Każda instancja ma unikalny ID instancji. Kilka instancji może działać jednocześnie — jedna zakotwiczona na początku korekty, inna na poprzednim impulsie — bez konfliktów ikon czy etykiet.
KLUCZOWE CECHY
- Przeciągana ikona kotwicy — umieść na dowolnym pasku, przeciągnij, aby dostosować, ŚK aktualizuje się natychmiast
- Pięć typów ŚK (SMA, EMA, ALMA, KAMA, VWAP)
- Osiem źródeł cen (Otwarcie, Maksimum, Minimum, Zamknięcie, Średnia, Mediana, Typowa, Ważona)
- Limit Maksymalnego Okresu z przesuwanym oknem od punktu kotwicy
- Opcjonalny panel statystyk z czterema pozycjami narożników
- Obsługa wielu instancji z unikalnymi ID
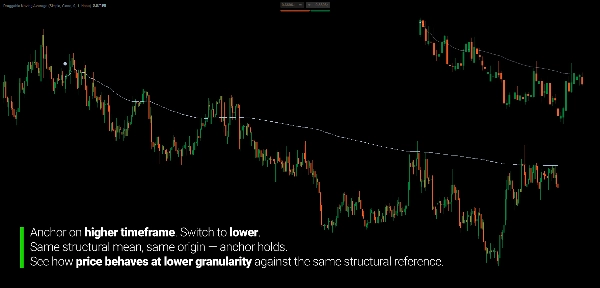
- Trwała kotwica podczas zmiany interwałów czasowych
DLA KOGO JEST TEN WSKAŹNIK
Ten wskaźnik jest dla traderów analizujących strukturę rynku na różnych interwałach — szczególnie tych, którzy chcą mierzyć zachowanie ceny od określonego punktu odniesienia strukturalnego, a nie arbitralnego okresu wstecz.
Jeśli analizujesz nogi korekcyjne i impulsowe na wyższych interwałach i potrzebujesz ocenić tę samą strukturę na niższych interwałach, przeciągana kotwica pozwala oznaczyć punkt startowy struktury raz i przenieść go przez widoki interwałów. Zakotwicz na wykresie dziennym, przełącz na M15 — odniesienie pozostaje.
Pasuje do traderów swingowych i pozycyjnych, którzy myślą w kategoriach ruchów strukturalnych, a nie stałych okresów, analityków wielointerwałowych, którzy potrzebują spójnych punktów odniesienia na wykresach oraz traderów dyskrecjonalnych, którzy chcą precyzyjnego, zdefiniowanego przez użytkownika kotwiczenia ŚK bez zgadywania okresu.
To nie jest system sygnałowy. To narzędzie do pomiaru strukturalnego dla traderów, którzy już myślą w kategoriach ruchów cen i chcą, aby ich średnia krocząca dokładnie odzwierciedlała te ruchy.
CO GO WYRÓŻNIA
Standardowe średnie kroczące są oparte na okresie. Ich odniesienie jest domyślne — n pasków wstecz od bieżącego paska. Gdy ruch strukturalny się kończy i zaczyna nowy, okres staje się nieistotny. Nie możesz wskazać standardowej ŚK na konkretne zdarzenie.
Ten wskaźnik czyni odniesienie jawne. Kotwiczysz do zdarzenia strukturalnego. ŚK mierzy od tego punktu. Okres nie jest wejściem — punktem strukturalnym jest.
Efekt: średnia krocząca, która odzwierciedla Twoją rzeczywistą analizę strukturalną, a nie jej przybliżenie.
---
ZROZUMIENIE ŚREDNIEJ KROCZĄCEJ JAKO ŚREDNIEJ STRUKTURALNEJ
Średnie kroczące są często błędnie rozumiane jako poziomy wsparcia i oporu. Traderzy czekają, aż cena "uszanuje" 50 ŚK lub odbije się od 200 ŚK, jakby te liczby miały wrodzone znaczenie rynkowe. Nie mają.
Średnia krocząca to arytmetyczny opis rozkładu — średnia cena w określonym oknie. To, czy ta linia jest znacząca, nie zależy od formuły, lecz od tego, czy mierzone okno ma znaczenie strukturalne.
Dlatego średnie oparte na okresie są zasadniczo ograniczone. ŚK 50-okresowa mierzy ostatnie 50 pasków — okno bez związku z jakimkolwiek zdarzeniem strukturalnym. Nie odpowiada miejscu, gdzie zaczął się trend lub korekta. To przesuwane okno o arbitralnej długości, którego pozycję determinuje tylko aktualność.
Gdy kotwiczysz do punktu strukturalnego, ŚK staje się średnią konkretnego, spójnego rozkładu cen od tego punktu do przodu. Gdy cena znacznie się od niej oddala, uczestnicy, którzy weszli w punkcie startowym, są narażeni na ryzyko. Gdy cena do niej wraca, odzwierciedla to wyrównanie rozkładu. Gdy cena przebija ją czysto, przeciętny uczestnik od punktu strukturalnego jest na zero lub stracie — to zmiana reżimu statystycznego, a nie złamanie linii.
Geometria nie jest przyczyną. To opis statystyczny rozkładu strukturalnego, którego granice zdefiniowałeś.
---
Trading wiąże się z ryzykiem. Ten wskaźnik jest narzędziem analizy technicznej — zawsze stosuj odpowiednie zarządzanie ryzykiem.


