
説明
KST Momentum Heatwave — モメンタムを市場の温度に変換(チャート上)
✅ 最新のKSTエンジン、最適化されたデフォルト設定(10/15/20/30 + 10/10/10/15、シグナル9)付き
✅ 真の価格オーバーレイ — KST + シグナルがベースラインEMAの周りに直接チャート上に投影されます
✅ 4つのビジュアルモード: プロスムース / クラシック / ローヒート / ツーティア
✅ モメンタムヒートマップ + グローで強さを即座に視覚化
✅ 正規化されたモメンタム強度でシンボルや時間軸間の一貫性を実現
✅ アンチチョップヒステリシスシステムで横ばい市場のノイズをフィルタリング
これは従来のオシレーターではありません。
KST Momentum Heatwaveは古典的な Know Sure Thing (KST) 指標を チャート上に直接構築された視覚的モメンタム温度システムに変換します。
チャート下のオシレーターを見る代わりに、モメンタムは 価格の上に動的なレイヤーとなり、方向、強さ、モメンタムのライフサイクルを即座に解釈できる形で示します。
インジケーターの機能と設計目的
KST Momentum Heatwaveはモメンタムデータを 市場圧力の視覚的温度マップに変換します。
従来のオシレーターはトレーダーに価格チャートと別のインジケーターウィンドウ間で注意を切り替えさせる必要があります。
このインジケーターはモメンタムを直接 価格チャート自体に投影することでその摩擦を取り除きます。
その結果、以下を即座に確認できるよりクリーンなワークフローが実現します:
- モメンタムが 加速しているとき
- トレンドが 強く支配的なとき
- モメンタムが 冷めているとき
- 市場が 低エネルギーのチョップに入るとき
これはトレーダーが迅速に特定したい以下のために設計されています:
- トレンドの強さ
- モメンタム継続の機会
- モメンタムの消耗
- レジームシフト
動きに力があるかどうかを推測する代わりに、 KST Momentum Heatwaveはその圧力を可視化します。
チャートにプロットされるものと読み方
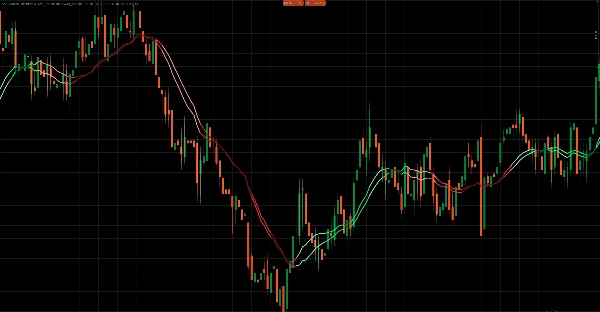
インジケーターは 2本のモメンタムラインを価格チャート上に直接プロットし、視覚的なヒートレイヤーも表示します。
1. KSTライン — モメンタムコア
4つの加重ROCコンポーネントから計算される主要なモメンタムラインです。
解釈:
- KSTがシグナルの上 → 強気モメンタム
- KSTがシグナルの下 → 弱気モメンタム
2本のライン間の距離は モメンタムの強度を示します。
2. シグナルライン — モメンタムトリガー
KSTラインの平滑化移動平均です。
これは モメンタムトリガーラインとして機能します。
- KSTとシグナルのクロスオーバーはしばしば モメンタムの変化や加速を示します。
3. モメンタムヒートレイヤー
インジケーターはKSTとシグナル間の距離を 0から1の間の正規化された強度値に変換します。
この値が 色の強度とヒートマップの視覚化を駆動します。
解釈:
- 明るい/淡い色 → 強いモメンタム
- 通常の色 → 安定したトレンド圧力
- 暗い色 → モメンタムの弱まり
- 色の薄れ → 減速または移行の可能性
オプションの ヒートマップとグロー効果はローソク足自体を彩り、トレーダーが市場が「加熱」している瞬間を即座に確認できるようにします。
4. 価格投影レイヤー
生のオシレーター値をプロットする代わりに、インジケーターは モメンタムを価格に投影します。使用するのは:
- ベースラインEMA
- ATRスケールされた振幅
これによりオーバーレイがチャートに比例し、異なる市場や時間軸でもインジケーターが読みやすくなります。
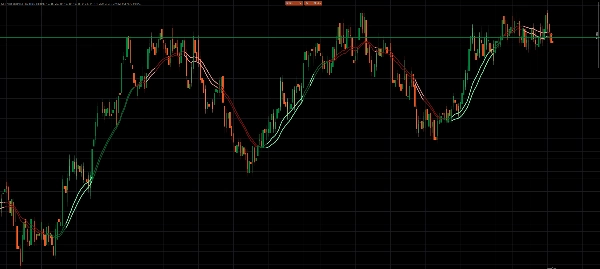
ビジュアルモードと動作
KST Momentum Heatwaveにはモメンタムの解釈方法を変える4つのビジュアルスタイルがあります。
プロスムース
最も高度なモードです。
特徴:
- ライフサイクルベースのモメンタム着色
- ヒステリシスフィルタリング
- 方向転換前の確認要件
これにより 横ばいまたはチョップ市場でのノイズが大幅に減少します。
クラシック
ヒステリシスフィルタリングなしでライフサイクル着色を使用します。
結果:
- より速いモメンタム反応
- 市場変動にやや敏感
主に 日中およびスイングトレードに適しています。
ローヒート
絶対的な モメンタム強度に純粋に焦点を当てます。
モメンタムは3つの階層に分類されます:
- 強い
- 中程度
- 弱い
このモードは 純粋なモメンタムパワーの読み取りを求めるトレーダーに最適です。
ツーティア
単純化された解釈モードです。
- KSTがシグナルの上/下で方向を定義
- 強さの閾値が 強いモメンタムと弱いモメンタムを定義
視覚的複雑さを最小限にしたいトレーダー向けに設計されています。
KST Momentum Heatwaveの使い方
ステップ1 — ビジュアルモードを選択
あなたのトレードスタイルに合ったモードを使用してください:
- プロスムース → ノイズの多い市場で最もクリーンなシグナル
- クラシック → より速い反応
- ローヒート → モメンタム強度に焦点
- ツーティア → シンプルな強弱の解釈
ステップ2 — モメンタムレジームを特定
支配的な色の挙動を探します:
- 強気の色が支配的 → ロングバイアス
- 弱気の色が支配的 → ショートバイアス
- 暗く薄れる色 → モメンタムの弱まり
- 頻繁な色の反転 → レンジ相場の可能性
ステップ3 — トレードタイミングにモメンタムを利用
典型的な使用例は以下の通りです:
トレンド継続
モメンタムレジームが維持され、強さが高いままのプルバック時にエントリーします。
モメンタム消耗
色が暗くなり、強度が低下したらエクスポージャーを減らします。
モメンタム反転
KST/シグナルの反転と強度の上昇を注視します。
推奨設定例
ほとんどの市場に適したバランスの取れた構成:
プリセット: Swing_Classic
ビジュアルモード: プロスムース
ベースラインEMA: 34
ATR期間: 14
ATR振幅: 1.40
正規化ルックバック: 200
ヒートマップ: 有効
グロー: 有効
推奨市場と時間軸
インジケーターは ATRスケーリングと正規化された強度を使用するため、ほとんどの市場に適応します。
特に効果的なのは:
外国為替
- 日中取引向けのM5 – H1
- スイングトレード向けのH1 – H4
株価指数
- モメンタムスキャルピング向けのM1 – M15
- 構造的トレンド取引向けのM15 – H1
暗号通貨
- M5 – H1(プロスムース推奨)
- トレンド環境向けのH1 – H4
コモディティ
- M15 – H4
低い時間軸では プロスムースフィルタリングが最も効果的です。
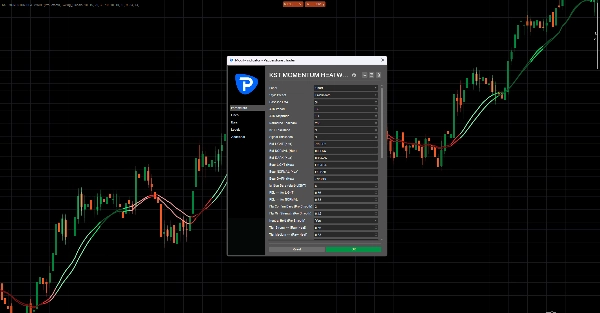
主要パラメーターとその制御内容
プリセットシステム
Scalp_Clean、Swing_Classic、Smooth、Aggressiveのプリセットは内部のKST設定を調整します。
カスタムモードでは完全な手動制御が可能です。
モメンタム正規化
正規化ルックバック
モメンタム強度をスケールするために使用される過去のウィンドウを制御します。
値が大きいほど読み取りが滑らかになります。
オーバーレイ投影
ベースラインEMA
モメンタムオーバーレイを投影するための基準線を定義します。
ATR振幅
オーバーレイがベースラインからどれだけ広がるかを制御します。
アンチチョップ制御(プロスムース)
フリップ確認バー数
レジーム変更を確認するために必要なバーの数。
フリップ最小強度
フリップを受け入れる前に必要な最小モメンタム強度。
ニュートラルホールド
弱いモメンタム条件下でレジームを安定させるのに役立ちます。
ヒートとグローの視覚化
ヒートマップがモメンタム強度にどれだけ反応するかを制御します。
パラメーターには以下が含まれます:
- ヒート幅
- ヒートアルファ
- ヒートガンマ
- グロー強度
パフォーマンス管理
保持バー数
インジケーターの動作をスムーズに保つためにチャート上に残る視覚オブジェクトの数を制限します。
重要な注意点
チャートオブジェクトの強度
ヒートマップとグロー効果は複数のオブジェクトを描画します。
パフォーマンスが低下した場合:
- 保持バー数を減らす
- ヒート幅を減らす
- グローを無効にする
強度の飽和
極端なボラティリティの急増により、強度が最大値に近づくことがあります。
これが起きた場合:
- 正規化ルックバックを増やす
- プロスムースモードに切り替える
構造と併用するのが最適
KST Momentum Heatwaveは モメンタムレジームレイヤーとして設計されており、単独のエントリー生成器ではありません。
最良の結果を得るには以下と組み合わせてください:
- サポートとレジスタンス
- 市場構造
- 流動性ゾーン
- トレンド分析


