
説明
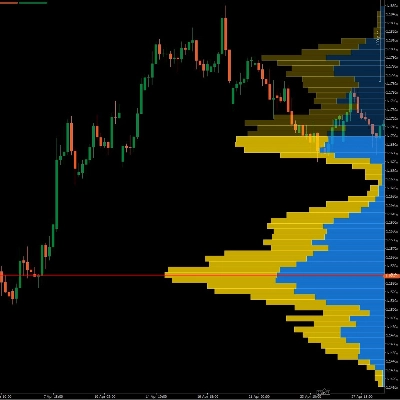
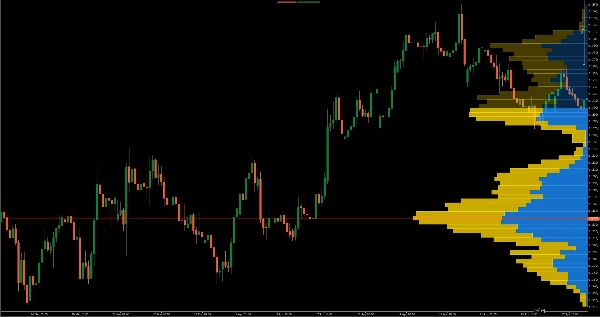
The Visible Range Volume Profile Pro (VPVR) は、cTrader専用に構築された機関投資家向けの動的ボリューム分析ツールです。固定された時間枠(例えば日次や週次)で計算される静的プロファイルとは異なり、このVPVRは画面に現在表示されている価格の動きのみに基づいて即座に再計算および再描画を行います。
1分間のEUR/USDスキャルピングのためにズームインする場合でも、マクロなスイングトレードのためにズームアウトする場合でも、プロファイルは即座に適応し、流動性がどこにあるかを正確に示します。
主な特徴:
- 真の動的再計算: チャートをスクロール、パン、ズームするたびにプロファイルが即座に更新されます。
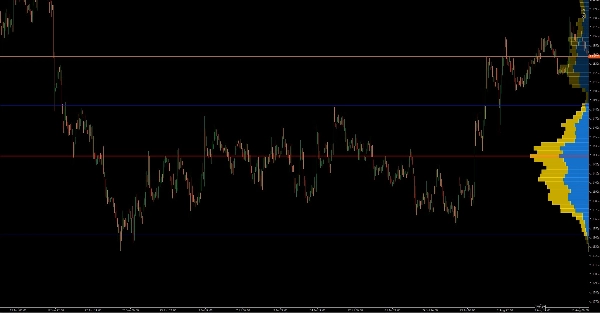
- 精密なバリューエリア(VA)&POC: コントロールポイント(POC)とバリューエリアの高値/安値(VAH/VAL)を明確に特定します。
- 履歴追跡(発展中のレベル): 「発展中」のラインでPOCとバリューエリアが時間とともにどのように変化したかを正確に視覚化し、変動するモメンタムを読み取ることができます。
- スマートアラートシステム: 再テストを見逃しません。価格が動的なPOC、VAH、またはVALに触れたときに、チャート上のポップアップ、カスタムPCサウンド、またはメール通知を即座に受け取れます。組み込みのクールダウン機能によりアラートのスパムを防止します。
- ボリューム分割: 各価格レベルでの買い(アップ)と売り(ダウン)のボリュームを視覚的に分解します。
- 高度にカスタマイズ可能なUI: 行の密度、不透明度、配置(左/右)、幅の割合、カラースキームを完全に調整して、カスタムテンプレートに合わせることができます(ダークモードに最適)。
概要
AIによる概要
Visible Range Volume Profile Pro (VPVR) is a dynamic volume analysis indicator designed for the cTrader platform. Unlike static volume profiles that use fixed timeframes, this tool recalculates and redraws volume distribution based solely on the price action visible on the chart in real time. It adapts instantly as users zoom, scroll, or pan, making it suitable for various trading styles from short-term scalping to longer-term swing trading.
Key functionalities include precise identification of the Point of Control (POC) and Value Area High/Low (VAH/VAL), with historical tracking of these levels through "Developing" lines to visualize momentum shifts. The indicator also splits volume into buying (up) and selling (down) components at each price level. A smart alert system notifies users via on-chart pop-ups, sounds, or email when price interacts with key volume levels, with built-in cooldowns to prevent alert spamming.
The user interface is highly customizable, allowing adjustments to row density, opacity, placement, width, and color schemes to fit different chart templates and preferences. This tool supports visualization of key volume-based levels and is tagged under key levels and volume indicators, aiding traders in identifying important market structure and liquidity zones.
インジケーターのプロフィール
インジケーターのカテゴリー
サポート&レジスタンス
出力の種類
ビジュアル表示
データ要件
取引高
バーのみ
ティックデータ
サポート対象のシグナル
ラインタッチ
ラインブレイク
ディスカッション
カスタマーレビュー
0.0
レビュー: 0
カスタマーレビュー
この商品にはまだレビューがありません。お使いになったことがある方は、ぜひレビューをお願いします。
よくあるご質問
Key Levels
Volume
cTrader Storeで入手可能な取引ボット、インジケーター、プラグインなどの商品は、第三者の開発者が提供するものであり、情報と技術の取得のみを目的としてご利用いただけます。cTrader Storeはブローカーではなく、投資助言や個人的な推奨を行うことも、将来のパフォーマンスを保証することもありません。
この作成者の他の商品









価格
登録日 11/10/2024
6
販売