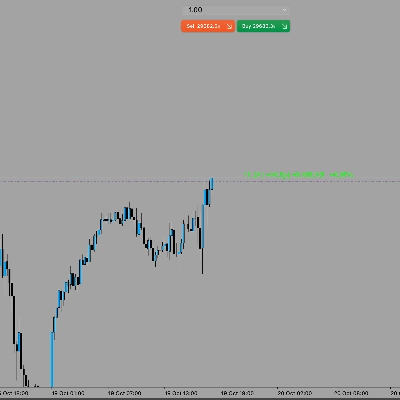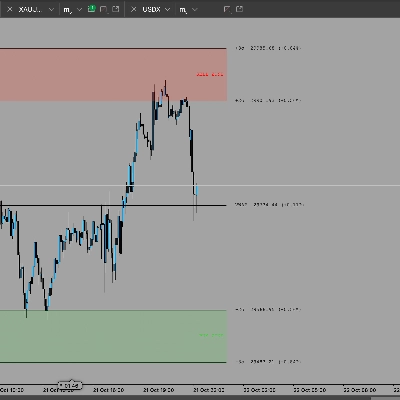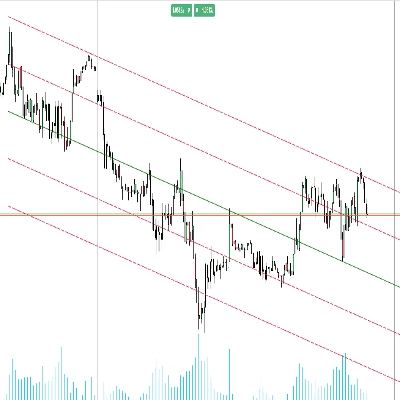
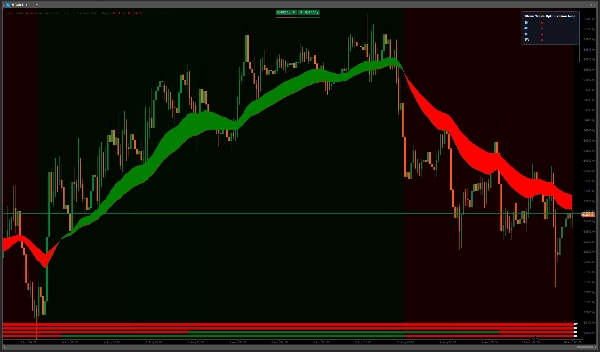
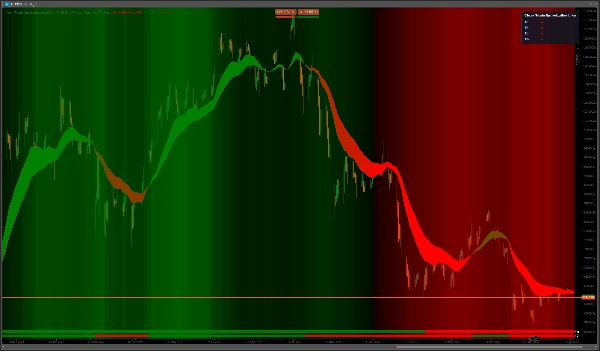
present
Sign up and get $50 off your first purchase
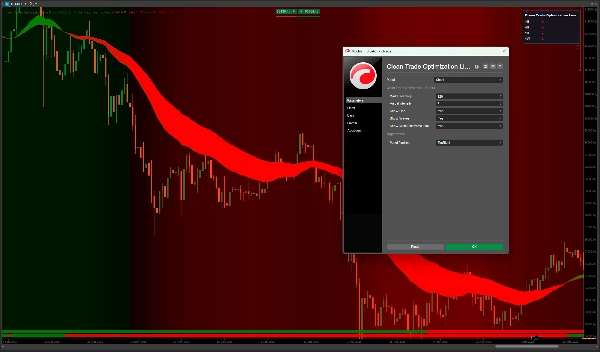
Trading product for Clean Trade Optimization Line Pro Indicator Supertrend, image 2
Trading product for Clean Trade Optimization Line Pro Indicator Supertrend, image 3
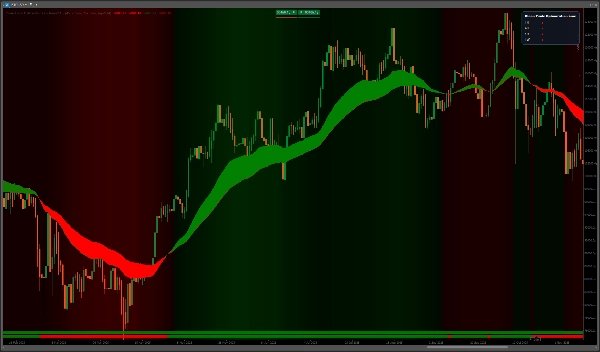
Trading product for Clean Trade Optimization Line Pro Indicator Supertrend, image 4
Trading product for Clean Trade Optimization Line Pro Indicator Supertrend, image 5
Since 23/07/2026

Description

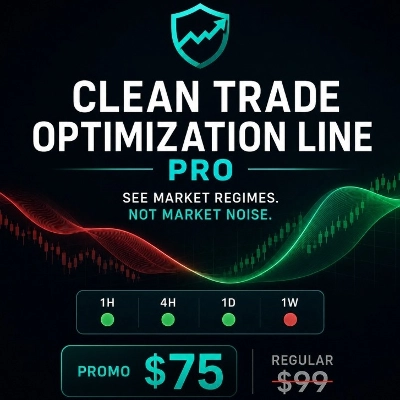
See market regimes. Not market noise.


Clean Trade Optimization Line Pro transforms complex price action into a clean, premium visual experience built for focus.


The directional ribbon makes changing market character immediately visible. Smooth background waves add broader context without clutter, while the multi-timeframe view keeps the bigger picture close at hand. Historical status bars align directly with the chart, helping you see how market context evolved alongside price.


The interface stays intentionally simple. Add Clean Trade Optimization Line Pro to a chart, choose the visual intensity you prefer, and focus on what matters.


Clean Trade Optimization Line Pro works beautifully with BTC on the 1D timeframe, where major market transitions can be viewed with exceptional clarity.


Highlights


• Premium ribbon visualization

• Smooth bullish and bearish market context

• Multi-timeframe status overview

• Chart-aligned historical context

• Clean, focused interface

• Non-repainting historical presentation

• Designed exclusively as a cTrader indicator


Less noise. More context. Better focus.


Clean Trade Optimization Line Pro is a technical analysis indicator only. It does not predict future market performance and does not guarantee profits or trading success.


Trade carefully. Manage your risk.
Summary

AI summary
Clean Trade Optimization Line Pro is a technical analysis indicator designed exclusively for the cTrader platform. It provides a premium visual representation of market regimes, focusing on clarity by filtering out market noise. The indicator features a directional ribbon that highlights changes in market character, smooth background waves to convey bullish and bearish context, and a multi-timeframe status overview to maintain awareness of broader market conditions. Historical status bars aligned with the price chart allow users to track how market context has evolved over time. Its interface is intentionally simple, enabling users to adjust visual intensity and focus on relevant market information. The indicator is optimized for use with Bitcoin (BTC) on the daily (1D) timeframe, where it helps identify major market transitions with enhanced clarity. It offers non-repainting historical data presentation to support reliable analysis. Key features include premium ribbon visualization, smooth market context waves, multi-timeframe overview, chart-aligned historical context, and a clean, focused interface. This product is categorized under trend indicators and supports visualization and signal outputs, including cross signals, based on bar data inputs.
Indicator profile
Indicator category
Trend
Output type
Signals
Visualisation
Data requirements
Bars only
Supported signals
Cross

Discussion

Customer reviews

0.0
Reviews: 0
Customer reviews
No reviews for this product yet. Already tried it? Be the first to tell others!

FAQ

Supertrend
Products available through cTrader Store, including trading bots, indicators and plugins, are provided by third-party developers and made available for informational and technical access purposes only. cTrader Store is not a broker and does not provide investment advice, personal recommendations or any guarantee of future performance.

You may also like

Indicator
ATR
SMC
+12
Next-gen SMC + ICT strategy. Institutional signals, A+ scoring, and precision entries built for modern markets.
Indicator
Auto Fibonacci Retracement Indicator for cTrader
Indicator
Risk Dashboard
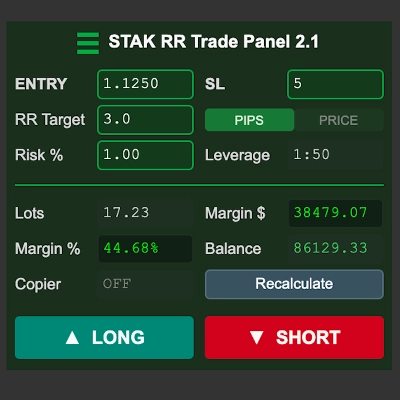
Risk-based lot sizing, exact stop placement and hard margin limits. Nothing is sent until you confirm.
Indicator
EMA
RSI
+4
🚀📈 Plot buy/sell signals on Range Bars using Moving Averages and RSI. Clear, actionable trading insights.🚀📈
Indicator
ATR
Volume
+1
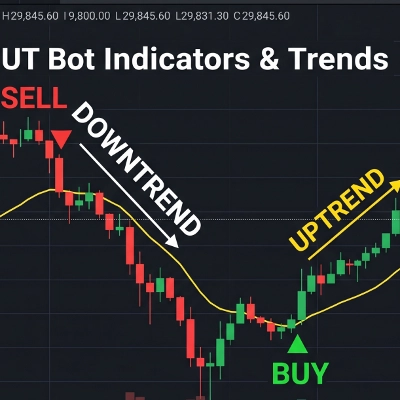
The UT Bot identify potential trend reversals and momentum shifts.
Indicator
Forex
BTCUSD
+4
The Linear Regression Oscillator (LRO) is a technical indicator based on linear regression analysis.
Indicator
Volume
Key Levels
Draw custom tick-volume profiles with POC, Value Area, fixed/live ranges and optional price alerts.
Indicator
ATR
EMA
+5
Candle timer with live profit tracking on chart – displays pips, currency value, and percentage in real time.
Indicator
ATR
SMC
+2
HTF POWER 3 ICT Power of 3 · M1 Precision · H4 Intelligence Auto-detect Accumulation → Manipulation → Distribution
Indicator
BOS
Fibonacci
+4
Automatically draws major trading sessions, killzones, and SMC daily liquidity targets directly on your cTrader charts.
Indicator
Volume
Key Levels
Interactive tick-volume profile with a draggable range box, sculpted histogram, and POC, VAH and VAL levels.
Indicator
BOS
EMA
+5
VWAP Bands indicator with 3 standard deviation levels, buy/sell zones, and a draggable ON/OFF button to toggle the entir
Indicator
Forex
BTCUSD
+11
Visualize trends with Standard Deviation Channel! Display median, and add customizable upper/lower deviation channels.
Indicator
ATR
Forex
+6
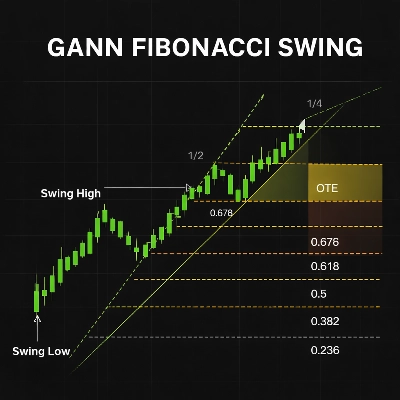
It combines swing (pivot-based) market structure detection with Gann Fan geometry and Fibonacci retracement/extension
Indicator
MACD
Prop
+14
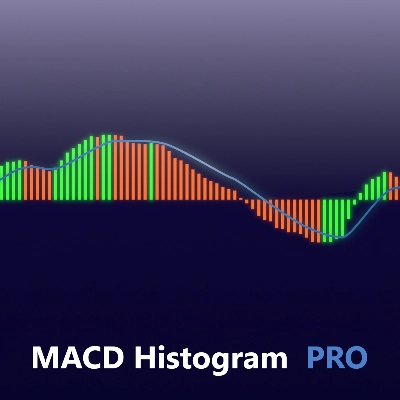
Enhance MACD Histogram! Visualize bull and bear price changes with vibrant colors for clearer, more insightful trading.
Indicator
Forex
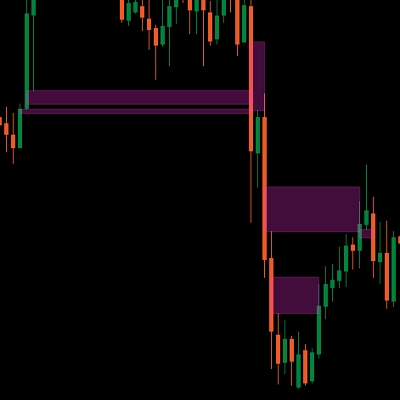
Detects valid Fair Value Gaps from strong 3-bar patterns. Keep drawing unfilled gaps until price fills them.
Indicator
The Multi-Timeframe Candle Indicator displays candles from multiple timeframes in one window, enhancing market analysis!
"rvwap v1" logo
Popular
4.6
(5)
$19
Indicator
Prop
VWAP
+13
Rolling VWAP with dynamic or fixed time window, customizable source price and standard deviation bands.

Price

Since 23/07/2026