Mô tả
Chỉ báo này là một công cụ phân tích và tín hiệu trực quan được thiết kế để tự động hóa các chiến lược giao dịch dựa trên các phiên hoặc các đột phá theo giờ cụ thể.
📊 Điều Kiện Thị Trường Được Phân Tích Chỉ báo tách biệt Hành Động Giá của một giờ cụ thể do người dùng định nghĩa. Nó tự động ghi lại điểm cao nhất và thấp nhất của giờ tham chiếu này (gọi là "Phạm vi") và sử dụng chúng như các mức chính cho phần còn lại của ngày giao dịch. Các phép tính được đặt lại hàng ngày vào lúc nửa đêm.
👁️ Giải Thích Tín Hiệu & Các Yếu Tố Trực Quan Chỉ báo được thiết kế để hoàn toàn trực quan 100%:
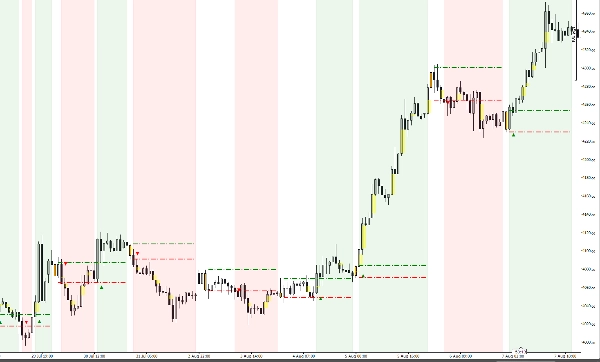
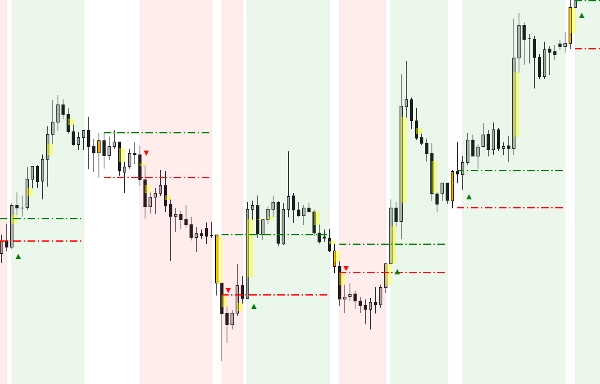
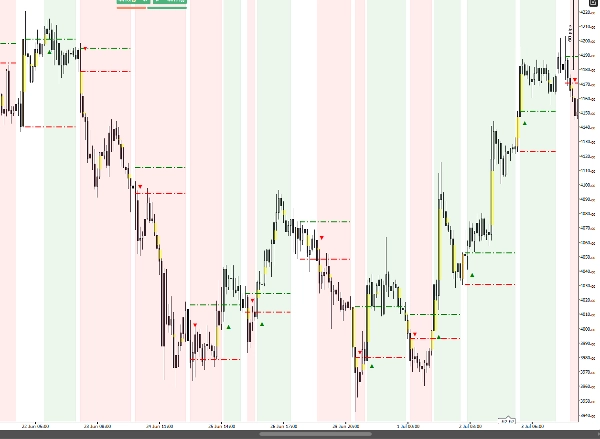
- Nến Mục Tiêu Có Màu: Nến giờ tham chiếu được làm nổi bật (cả phần tô và viền) để nhận diện ngay lập tức.
- Đường Chấm (Cao/Thấp): Những đường này chiếu phạm vi tham chiếu trên toàn bộ ngày giao dịch.
- Mũi Tên Tín Hiệu (▲/▼): Một mũi tên xuất hiện ngay khi một cây nến đóng cửa ngoài phạm vi (đột phá được xác nhận), cung cấp điểm vào rõ ràng.
- Vùng Nền Có Màu: Nền biểu đồ được nhuộm màu xanh lá (xu hướng tăng) hoặc đỏ (xu hướng giảm) để chỉ ra động lực hiện tại sau đột phá.
⚙️ Tham Số & Cài Đặt Chính
- Giờ Mục Tiêu (0-23): Chọn giờ tham chiếu (giữ mặc định).
- Thiết Kế Tùy Chỉnh 100%: Chọn màu cho các đường đột phá (Cao/Thấp), nến tham chiếu và viền của nó.
- Độ Mờ Nền: Điều chỉnh độ trong suốt (0-255) của các vùng xu hướng để giữ cho biểu đồ của bạn sạch sẽ và dễ đọc.
📈 Các Trường Hợp & Kịch Bản Sử Dụng Điển Hình Lý tưởng cho Giao Dịch Trong Ngày Vàng (XAUUSD). Kịch bản điển hình bao gồm việc khung biến động trước thị trường (ví dụ, phiên châu Á hoặc trước London) và giao dịch động lực mạnh mẽ xảy ra khi phạm vi này bị phá vỡ vào lúc mở cửa các thị trường lớn.
Tóm tắt
The indicator provides clear visual cues: the reference hour candle is highlighted with distinct colors; arrows appear when a candle closes outside the established range, signaling a confirmed breakout; and the chart background shifts to green or red to indicate bullish or bearish momentum following the breakout. Users can customize the target hour, colors of breakout lines and reference candle, and the opacity of background trend zones.
Typical use involves capturing pre-market volatility, such as during the Asian or pre-London sessions, and trading the momentum that follows when the price breaks out of the defined range at major market opens. The indicator supports breakout and trend strength signals based on bar data and tick data inputs.