present
新規登録で初回購入時に$50オフ
Trading product for HCapitalFisherTransform インジケーター Market Structure Supply & Demand, image 1
HCapitalFisherTransform
インジケーター
1 ダウンロード数
バージョン 1.0、Aug 2026
Windows、Mac
Trading product for HCapitalFisherTransform インジケーター Market Structure Supply & Demand, image 2
Trading product for HCapitalFisherTransform インジケーター Market Structure Supply & Demand, image 3
Trading product for HCapitalFisherTransform インジケーター Market Structure Supply & Demand, image 4
登録日 09/03/2026
3.06M
取引数量
253.65K
獲得pips
296
無料インストール

説明

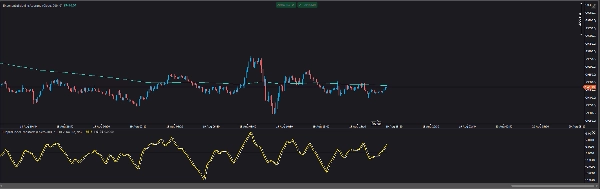
H Capital Fisher Transform is a free cTrader implementation of the Fisher Transform developed by John F. Ehlers.

The indicator measures where price is positioned within its recent range, then applies the Fisher mathematical transformation to amplify values near the upper and lower extremes. This produces the sharp peaks and troughs for which the Fisher Transform is known and can make changes in short-term market direction easier to visualize.

This version was built with an emphasis on formula accuracy, transparency, and simplicity rather than adding unnecessary features or promising unrealistic trading results.

Included

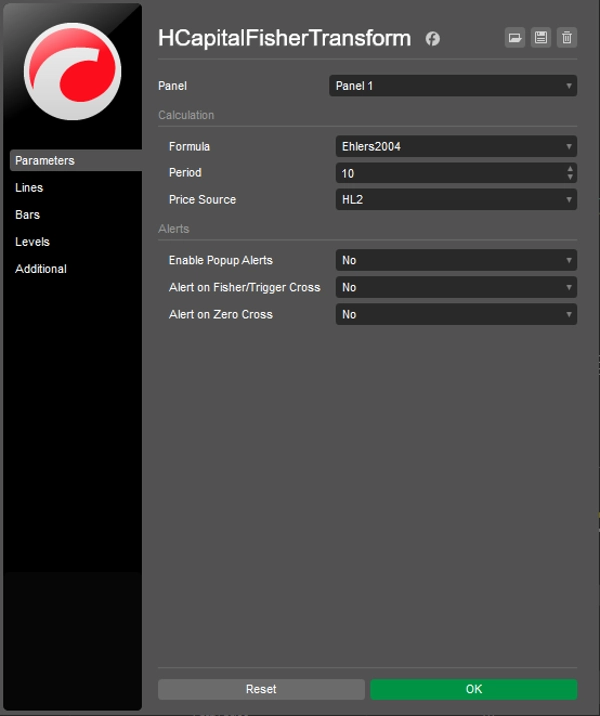
  • Ehlers 2004 Formula — the later formulation used as the default.
  • Ehlers 2002 Formula — the original published version available as an optional mode.
  • Adjustable lookback period.
  • Multiple price-source options.
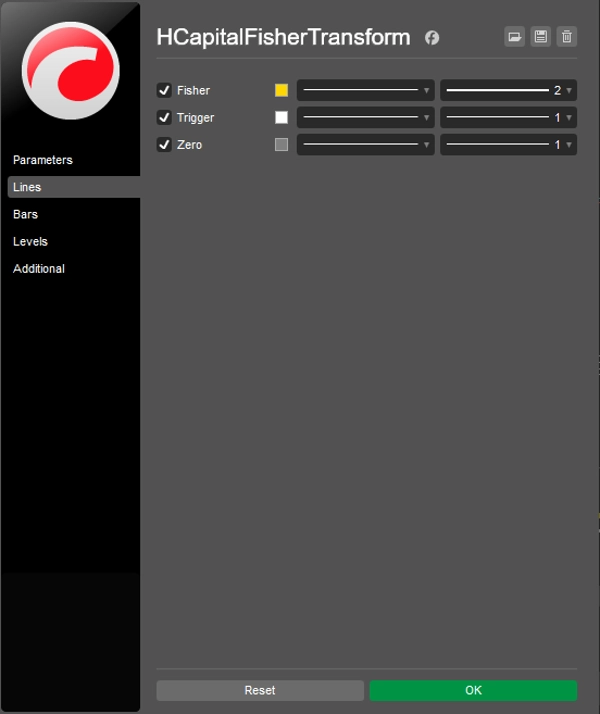
  • Fisher line.
  • Trigger line.
  • Zero reference line.
  • Optional Fisher/Trigger crossover alerts.
  • Optional zero-cross alerts.
  • Alerts based on confirmed closed bars.
  • Public output series for future cBot or indicator integration.
  • No future-bar calculations or look-ahead logic.

How to read it

A rising Fisher value indicates that price is moving toward the upper portion of its recent range.

A falling Fisher value indicates that price is moving toward the lower portion of its recent range.

The Trigger is the previous Fisher value. A crossover therefore highlights a change in the short-term direction of the Fisher line.

Large positive or negative readings show that price is near an extreme of its recent range. They should not automatically be interpreted as buy or sell signals.

A strong trend can keep Fisher at an extreme for an extended period, and the indicator can produce false turns during trending or choppy market conditions.

For that reason, Fisher is generally more useful as a market-analysis and confirmation tool than as a standalone trading system.

H Capital approach

This indicator is part of the H Capital project to research established trading indicators, understand the mathematics and evidence behind them, rebuild useful tools for cTrader, and make them freely available.

No claimed win rates.
No hidden logic.
No paywall.

Research it. Build it. Test it. Share it.

This indicator is provided for research and educational purposes and does not guarantee profitable trading results.

概要

インジケーターのプロフィール
インジケーターのカテゴリー
モメンタム
出力の種類
ビジュアル表示
シグナル
データ要件
バーのみ
サポート対象のシグナル
トレンドの強さ

カスタマーレビュー

0.0
レビュー: 0
カスタマーレビュー
この商品にはまだレビューがありません。お使いになったことがある方は、ぜひレビューをお願いします。

ディスカッション

よくあるご質問

Market Structure
Supply & Demand
Liquidity Grab
cTrader Storeで入手可能な取引ボット、インジケーター、プラグインなどの商品は、第三者の開発者が提供するものであり、情報と技術の取得のみを目的としてご利用いただけます。cTrader Storeはブローカーではなく、投資助言や個人的な推奨を行うことも、将来のパフォーマンスを保証することもありません。

この作成者の他の商品

インジケーター
Grid
Prop
+4
A free institutional-style chart tool that maps key daily liquidity levels in a clean H Capital interface.
cBot
Prop Firm Fit
One-click Trading
+3
Watches your equity in real time and blocks new trades the moment you're near your daily or max loss limit.

これも好きかも

インジケーター
Prop
Forex
+4
Automatic Support/Resistance zones from swing points.
インジケーター
ATR
Key Levels
+1
See both sides of the trade before you take either one.
インジケーター
AI
SMC
+5
Complete ICT Killzones: 5 sessions, easy colors, transparency controls & session info. Professional timing for cTrader.
インジケーター
BOS
Volume
+5
20/40/60-day IPDA lookback ranges, Premium/Discount/Equilibrium zones, and quarterly shift alerts — anchored to true dai
インジケーター
This indicator can be used to: change color, shape size, position, change font, increase or decrease, and other function
インジケーター
BOS
Key Levels
+1
Guided by Yahuah Yahusha. 15M: BOS above red (buys)/below green (sells). 4HC reject+BOS. 5M: RBS/SBR. SL wick. TP 1:4.
インジケーター
BOS
MSS
+5
One indicator, full ICT/SMC picture — structure, OBs, FVGs, liquidity, Premium/Discount — with graded PRIME/SETUP signal
インジケーター
ATR
EMA
+4
SCALPING M1 CTRADER v1.0 — Institutional-Grade M1 Gold & Forex Scalping System
インジケーター
Forex
EURUSD
+4
Check the correlations between dozens of assets in one elegant display.
インジケーター
RSI
Breakout
+1
Price action to detect when the market changes trend (MSB) and defines, order blocks , ZigZag etc.📊
インジケーター
EURUSD
Plots chosen symbol's close price, candlestick (wick, body) on cTrader chart, supports multiple timeframes.
インジケーター
Market entropy + DC. Spot crystallization/chaos shifts with an optional on-chart overlay.
インジケーター
ATR
RSI
+5
Dual confirmation RSI + EMA crossover signals with visual alerts and dynamic ATR offsets.
インジケーター
Prop
VWAP
+15
VWAP: Follow the smart money. Trade with real volume and the fair price on your side!
インジケーター
RSI
VegaXLR's cTrader StochRSI identifies overbought/oversold RSI levels for precise trade entries.
インジケーター
VWAP
Volume
+5
The MA Quant Volume Profile Custom Range is a trading indicator that analyzes volume distribution across the price.
インジケーター
Project market behavior by integrating price and volume data across multiple time dimensions
インジケーター
Forex
Crypto
+3
Perfect Trend

価格

登録日 09/03/2026
3.06M
取引数量
253.65K
獲得pips
296
無料インストール