present
新規登録で初回購入時に$50オフ
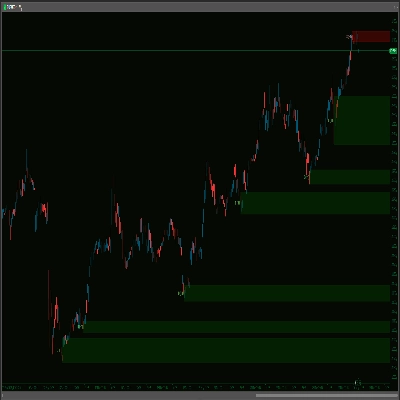
Trading product for Break Tracer インジケーター EMA SMA, image 1
Break Tracer
インジケーター
112 ダウンロード数
バージョン 1.0、Sep 2026
Windows、Mac
4.6
レビュー: 3
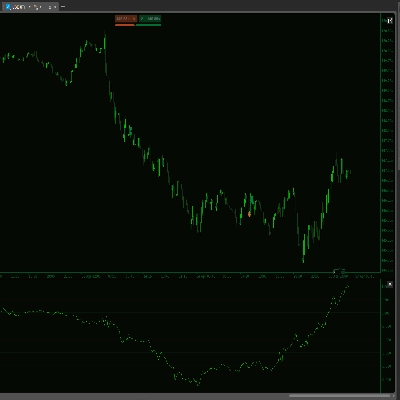
Trading product for Break Tracer インジケーター EMA SMA, image 2
Trading product for Break Tracer インジケーター EMA SMA, image 3
Trading product for Break Tracer インジケーター EMA SMA, image 4
Trading product for Break Tracer インジケーター EMA SMA, image 5
Trading product for Break Tracer インジケーター EMA SMA, image 6
Trading product for Break Tracer インジケーター EMA SMA, image 7
Trading product for Break Tracer インジケーター EMA SMA, image 8
Trading product for Break Tracer インジケーター EMA SMA, image 9
Trading product for Break Tracer インジケーター EMA SMA, image 10
Trading product for Break Tracer インジケーター EMA SMA, image 11
16
販売
339
無料インストール

説明

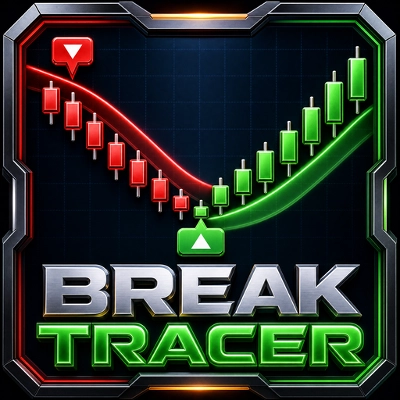
Break Tracerはトレンドを2層で読み取り、両方が一致したときにのみ動作します。


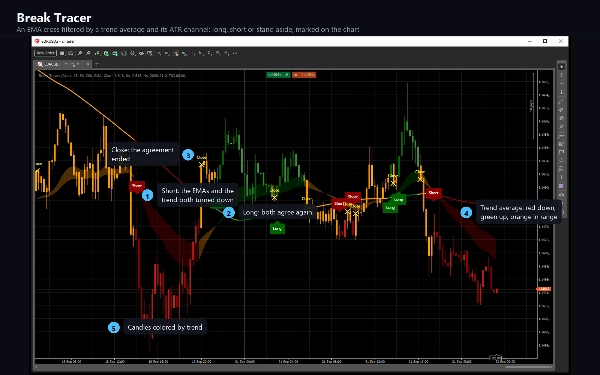
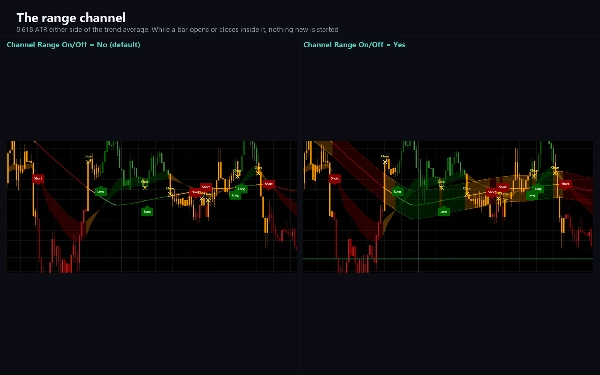
高速な指数移動平均線のペア(26と50)が短期の方向性を示します。200バーのトレンド平均線は、その周囲に平均真の範囲の0.618倍のチャネルを持ち、トレンドを示します。高速ペアが上向きで価格がトレンド平均線の上にあるときはトレンドは上昇、両方が下向きのときは下降、バーがチャネル内で始まりまたは終わる間は、市場はレンジ相場として扱われ、新たな動きは開始されません。


見えるもの


緑または赤の色調のトレンドライン、市場がレンジ相場の間はオレンジ色。

同じ色で塗りつぶされた2つの高速平均線間の帯。

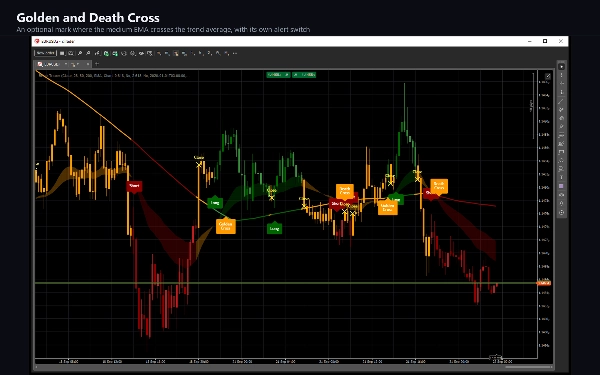
上昇トレンドが始まるバーの下にロングプレート、下降トレンドが始まるバーの上にショートプレート。

トレンドまたは高速平均線が反転したためにポジションがクローズされた場所に黄色のクロス。

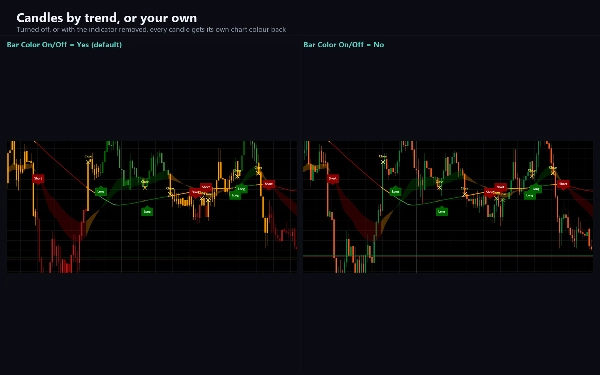
トレンドで色付けされたローソク足、トレンドに逆らってクローズしたローソク足は薄い色調。

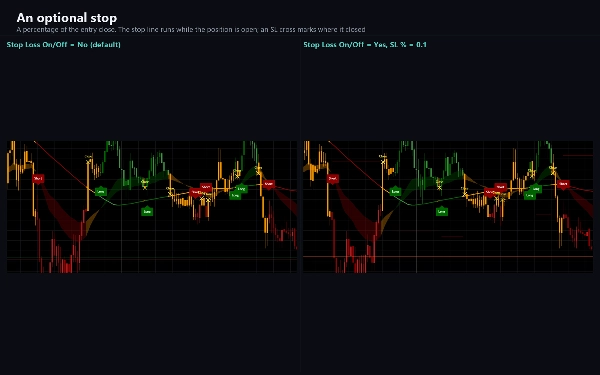
オプション:チャネル自体、ポジションをクローズしたレベルにあるSLクロス付きのストップライン、中間平均線がトレンド平均線をクロスするゴールデンクロスとデスクロスのプレート、および選択した日付ウィンドウの外側の灰色のシェーディング。


使い方


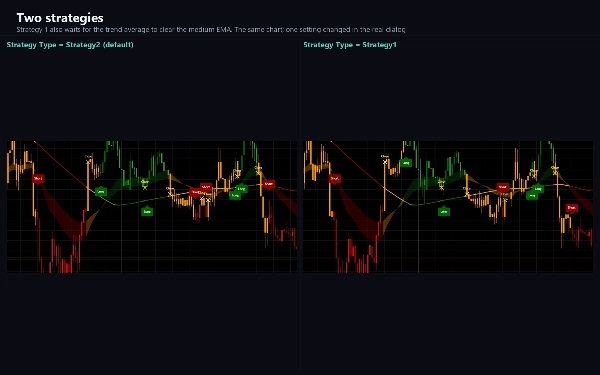
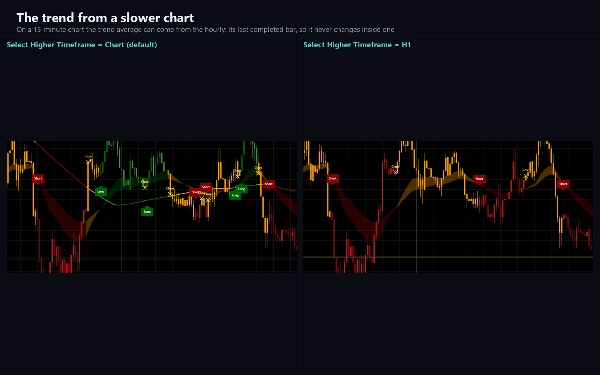
ロングまたはショートプレートは両層が一致した瞬間を示し、クローズクロスは一致が止まった瞬間を示します。デフォルトのストラテジー2はすべての一致を取ります。ストラテジー1はより厳格で、トレンド平均線が中間平均線の間違った側にある間は待機します。ロングのみ、ショートのみ、または両方を選択可能です。トレンド平均線はより高い時間軸から取ることもでき、例えば5分チャートで1時間足を使い、その場合は最後に完了した高時間軸のバーを使用するため、そのバー内で変化しません。


設定


ソース、EMAの長さ、トレンド平均線の長さとタイプ(SMAまたはEMA)、高時間軸、チャネル幅、オプションのパーセントストップ、オプションの日付ウィンドウ、ストラテジータイプ、取るサイド。各描画要素には独自のスイッチがあり、1つをオフにしても描画のみが変わり、値、アラート、Webhookは継続します。


アラートとWebhook


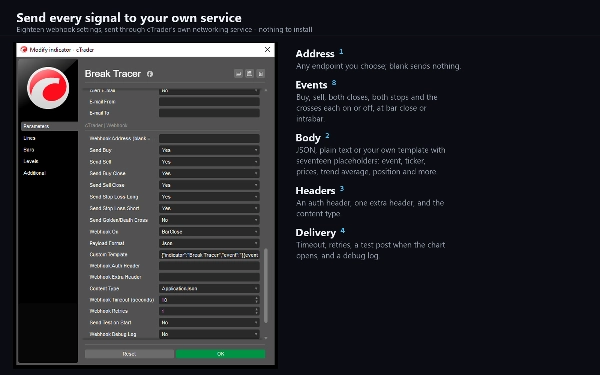
6つのイベント:買い、売り、買いクローズ、売りクローズ、ロングのストップロス、ショートのストップロス、さらにオプションでゴールデンクロスとデスクロス。各イベントに独自のスイッチがあり、バーのクローズ時または条件が満たされた瞬間に発火可能。配信はログライン、サウンド、またはメール。Webhookもあり、アドレスを入力すると各イベントがJSON、プレーンテキスト、またはシンボル、時間軸、時間、価格、平均線、トレンド状態、ポジションのプレースホルダーを含むテンプレートで投稿されます。入力するまでオフのままで、履歴通過やバックテスト中は送信されず、特別なアクセス権は不要で、cTraderのネットワークサービス経由で投稿されます。


cBOTS用


トレンド平均線、両方の高速平均線、トレンド状態、ポジション状態が出力シリーズとして公開されます。


タイプとウィンドウ


価格チャート上に描画されるトレンドインジケーター。


時間軸と銘柄


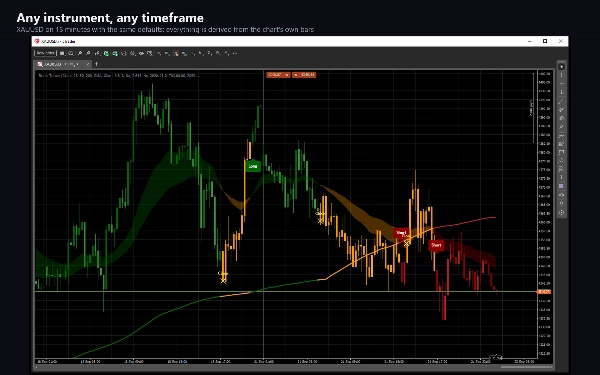
任意の時間ベースの時間軸。デフォルトはM5からH4までよく機能し、高時間軸オプションにより低時間軸チャートが遅いトレンドに追従可能。使用するすべてがバー自体から派生しているため、通貨ペア、金属、指数、暗号通貨などあらゆる銘柄で動作します。


対象者


トレンドフィルターを視覚的に確認したいトレーダー:いつロングすべきか、いつショートすべきか、いつ待機すべきか、変化のたびにアラートが欲しい人。


注意事項


マークはまだ形成中のバーに従うため、そのバーがクローズするまで現れたり消えたりします。アラートとWebhookの投稿はデフォルトでバーのクローズ時に行われ、条件が確定します。新しいチャートでは、最初のマークは2本目のバーでのショートです。平均線が存在するまで測定できないためです。


取引にはリスクが伴います。過去の成績は将来の結果を保証するものではありません。

概要

AIによる概要
Break Tracer is a trend indicator designed for use on price charts across any time-based timeframe, suitable for instruments including forex pairs, metals, indices, and cryptocurrencies. It combines two layers of trend analysis: a fast pair of exponential moving averages (EMAs) with periods 26 and 50 to capture short-term direction, and a slower 200-bar trend average (SMA or EMA) surrounded by an ATR-based channel (0.618 times the average true range) to define the overall trend. The indicator signals a trend only when both layers agree—uptrend when fast EMAs point up and price is above the trend average, downtrend when both point down, and a ranging market when price bars fall inside the ATR channel.

Visual elements include a color-coded trend line (green/red for trend, orange for range), shaded bands between fast EMAs, Long and Short plates marking trend starts, yellow crosses indicating position closes, and candles colored by trend strength. Optional features include the ATR channel display, stop lines with stop-loss crosses, Golden and Death Cross plates, and customizable date window shading.

Break Tracer supports configurable strategies for trade entries and exits, higher timeframe trend averaging, and selective long/short signals. It provides six alert events (Buy, Sell, Close, Stop Loss, Golden/Death Cross) with customizable delivery via log, sound, email, or webhook posting JSON or templated messages. Output series for cBots include trend averages and position states. Settings allow adjustment of sources, lengths, channel width, stop percentages, and visual elements independently.
インジケーターのプロフィール
インジケーターのカテゴリー
トレンド
出力の種類
ビジュアル表示
シグナル
データ要件
バーのみ
サポート対象のシグナル
クロス
ラインブレイク

ディスカッション

カスタマーレビュー

4.6
レビュー: 3
5
67 %
4
33 %
3
0 %
2
0 %
1
0 %
カスタマーレビュー
October 11, 2026
Break Tracer combines a fast EMA layer with a slower trend filter into a clear visual regime model. Testing on EURUSD and XAUUSD across H1 and M1 showed consistent trend colors, Long/Short transitions, Close markers and stable rendering.
October 6, 2026
The 26 and 50 EMA crossover gets useful context from a 200 bar trend average and a 0.618 ATR channel. Higher timeframe values wait for their candle to close, with webhooks available for alerts rather than order execution by the indicator.
October 1, 2026

よくあるご質問

EMA
SMA
Channel
ATR
Moving Average
cTrader Storeで入手可能な取引ボット、インジケーター、プラグインなどの商品は、第三者の開発者が提供するものであり、情報と技術の取得のみを目的としてご利用いただけます。cTrader Storeはブローカーではなく、投資助言や個人的な推奨を行うことも、将来のパフォーマンスを保証することもありません。

この作成者の他の商品

インジケーター
ATR
CCI
+4
A trend line that never steps back, a shaded band to the price, and a pointer at the swing where the trend turns.
cBot
Balanced
Fixed Lot
+5
Gold grid cBot for XAUUSD H1: four-signal confluence on closed bars, ladders closed at a basket profit, news filter
15.6%
ROI
2.33
プロフィットファクター
インジケーター
ATR
RSI
+5
Fusion trend line with a layered cloud, BULL and BEAR labels, scored re-entry triangles and exit markers.
インジケーター
ATR
RSI
+4
RSI bands drawn on price, confluence-scored BUY/SELL signals, an ATR stop with three targets
インジケーター
ADX
ATR
+5
EMA-cross signals scored on six confluence layers, with an ATR stop, three targets and a live panel
インジケーター
ATR
RSI
+4
Adaptive Ichimoku with nine-factor confluence scoring, five signal types, smart TP/SL and an MTF panel.
インジケーター
ADX
ATR
+5
SuperTrend signals scored on five confluence factors, with an ATR stop, three targets and a dashboard.
インジケーター
ATR
EMA
+4
Range-filter BUY/SELL signals scored by four confluence layers, with a stop, five targets and a trend panel
インジケーター
ATR
Volume
+3
Fibonacci trend signals on closed bars, with an ATR stop, up to four targets and a break-even ladder.
cBot
TP Manager
Break Even
+5
Gold cBot for prop-firm accounts: pick your firm, phase and size; risk is sized from the firm's rules, its limits kept
1.6
プロフィットファクター
インジケーター
ATR
EMA
+2
Eight-EMA ribbon with ATR trade zones, a nine-symbol screener and a five-timeframe trend dashboard.
インジケーター
ADX
ATR
+5
Ten confluence layers scored on every closed bar, with an anti-chop gate, pivot levels and a live dashboard.

これも好きかも

インジケーター
ZigZag
Indices
+2
Auto Trendlines, Fibonacci, Pitchfork and Patterns from non‑repainting pivots. One‑click Presets, targeted Alerts, and a
インジケーター
AI
ATR
+26
Liquidity Cluster Order automatically detects and draws accumulation zones & distribution zones
インジケーター
ADX
ATR
+5
EMA-cross signals scored on six confluence layers, with an ATR stop, three targets and a live panel
インジケーター
The long awaited new and improved Supply Demand Premium V2 indicator. Unlock greater trading opportunities now!
インジケーター
Forex
EURUSD
+2
DXY HMA Indicator
インジケーター
A compact, visual multi-timeframe trend indicator for cTrader. Easily spot bullish or bearish trends across 4 customizab
インジケーター
Intrinsic Recursive Value Indicator
「Zigzag Trend」ロゴ
トップ評価
4.5
(4)
$25
/
$45
インジケーター
AI
ATR
+23
The ZigZag Trend is a market structure tool that filters out small price fluctuations and highlights major swing.
インジケーター
ATR
Prop
+5
Anchor volume profiles to pivots with POC, VAH, VAL and real-time insights for clearer trade decisions.
インジケーター
ATR
SMC
+21
MA Quant Adaptive Price Zone Oscillator identifie dynamiquement les zones de prix optimales pour les entrées et sorties.
インジケーター
Forex
Crypto
+2
Unique Pyramid Design , Clear Price Action Trend
インジケーター
VWAP
Support & Resistance
Trading.FC$_vwap Algo shows VWAP trends, dynamic support/resistance and deviation bands to spot potential trade entries.
インジケーター
SMC
Forex
+5
Silver Bullet by LudwigICT
インジケーター
Key Levels
Trend-filtered signals, transparent trade plans and a multi-timeframe decision panel for cTrader.
インジケーター
SMC
Grid
+16
Institutional Supply & Demand Mapping Across Five Timeframes — Automatically.
インジケーター
Key Levels
Liquidity Grab
+2
The levels you mark each morning, drawn and followed: PDH/PDL, weekly, monthly, sessions, equal highs/lows.
インジケーター
ATR
BOS
+5
Opening ranges, dynamic trend channels, and multi-scale breakout/retest analysis for clear intraday chart decisions.
インジケーター
ATR
Key Levels
+1
Explore 88 harmonic price-pattern variants with interactive chart controls and geometric reference levels.

価格

16
販売
339
無料インストール