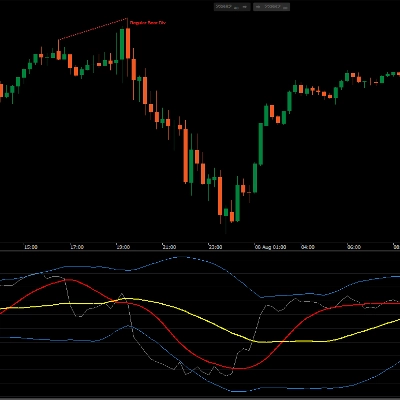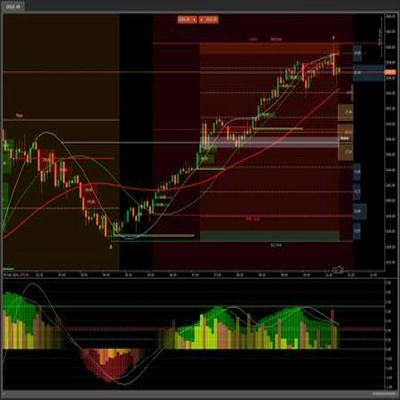
present
سجل واحصل على خصم 50 دولارًا على مشترياتك الأولى
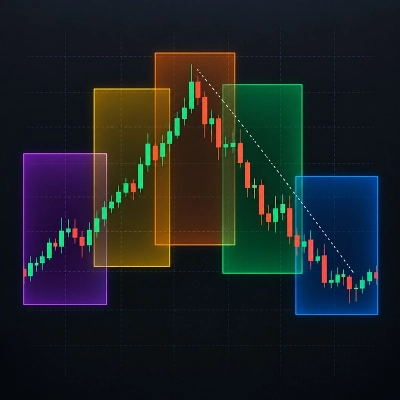
Trading product for Trend Sell Buy مؤشر Moving Average, image 2
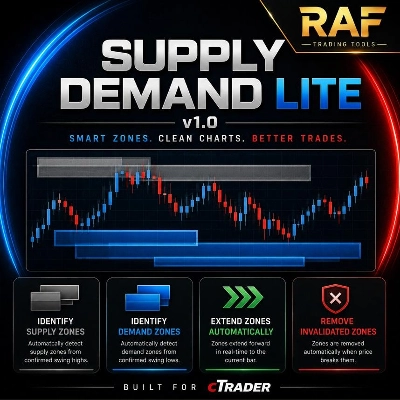
Trading product for Trend Sell Buy مؤشر Moving Average, image 3
Trading product for Trend Sell Buy مؤشر Moving Average, image 4
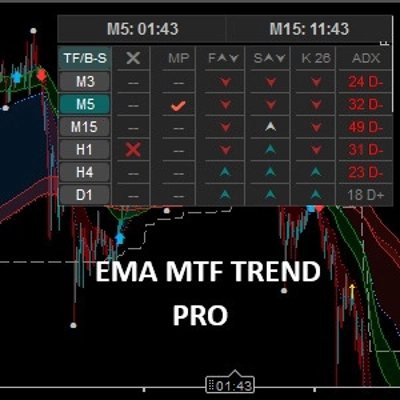
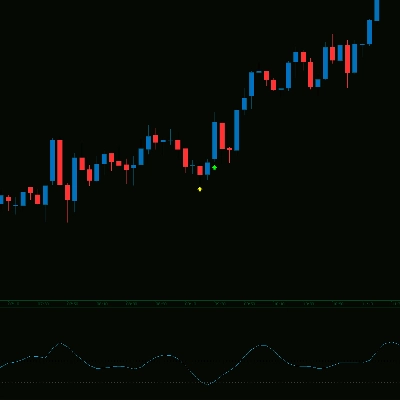
Trading product for Trend Sell Buy مؤشر Moving Average, image 5
منذ 21/01/2025

الوصف

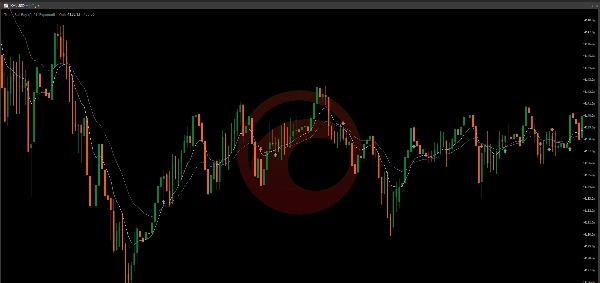
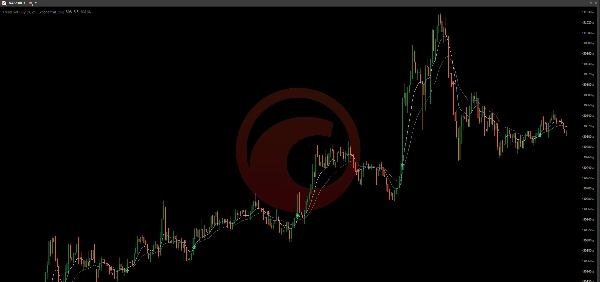
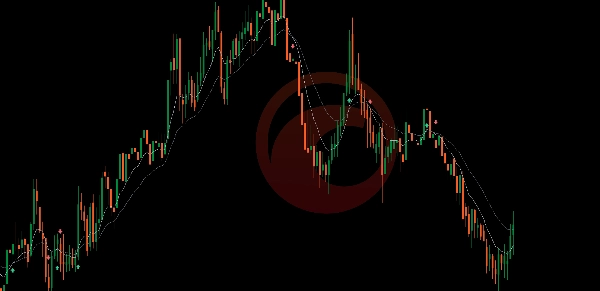
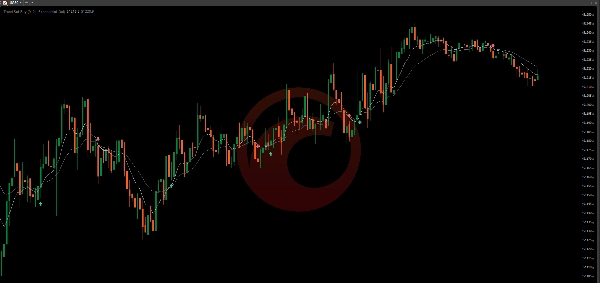
مؤشر Trend Sell Buy هو مؤشر اتجاه خفيف الوزن يعرض تغييرات الاتجاه المحتملة مباشرة على مخطط التداول. يقوم بتحليل أسعار الإغلاق باستخدام متوسط متحرك سريع وبطيء. يظهر سهم شراء أخضر عندما يتقاطع المتوسط السريع فوق المتوسط البطيء، بينما يظهر سهم بيع أحمر عندما يتقاطع المتوسط السريع تحته.


تشمل الإعدادات الرئيسية الفترة السريعة، الفترة البطيئة، نوع المتوسط المتحرك وخيار لإخفاء خطوط المتوسط. الفترات الافتراضية هي 9 و 21 مع المتوسطات الأسية.


يمكن استخدام المؤشر على الفوركس، المؤشرات، السلع والرموز الأخرى المتاحة في cTrader. وهو مناسب للفترات الزمنية داخل اليوم والفترات الأعلى ويهدف إلى المتداولين الذين يرغبون في تأكيد بصري بسيط لتقاطع المتوسطات المتحركة.


لا يقوم مؤشر Trend Sell Buy بفتح أو تعديل أو إغلاق الصفقات. تصف الإشارات شروط التقاطع التاريخية وقد تحدث متأخرة أو تنتج إشارات خاطئة في الأسواق الجانبية. دائماً اجمع بينها وبين تحليلك الخاص وإدارة المخاطر.


التداول ينطوي على مخاطر. الأداء السابق لا يضمن النتائج المستقبلية.

الملخص

ملخص الذكاء الاصطناعي
Trend Sell Buy is a trend indicator for cTrader that identifies potential trend changes using simple moving-average crossovers. It analyzes closing prices with two moving averages—a fast and a slow one—and marks crossover points directly on the chart. A green Buy arrow signals when the fast average crosses above the slow average, while a red Sell arrow indicates the opposite crossover. Key adjustable settings include the periods for the fast and slow averages, the type of moving average, and an option to hide the average lines. The default configuration uses exponential moving averages with periods of 9 and 21. This indicator supports various markets such as forex, indices, and commodities, and is suitable for intraday and longer timeframes. It provides visual confirmation of crossover signals but does not execute trades. Users should combine its signals with their own analysis and risk management. The indicator outputs visual signals based on historical crossover conditions.

مناقشة

تقييمات العملاء

4.0
التقييمات: 1
5
0 %
4
100 %
3
0 %
2
0 %
1
0 %
تقييمات العملاء
October 19, 2026
The 9 and 21 EMA arrows are easy to understand and the average lines can be hidden, making this a straightforward crossover display with the listing's acknowledged late and repeated signals in sideways markets.

الأسئلة الشائعة

Moving Average
مؤشر
Key Levels
Chart UI Tools
+2
مؤشر
Supply & Demand
Support & Resistance
مؤشر
RSI
MACD
+5
مؤشر
AI
RSI
+7
مؤشر
RSI
VWAP
+5
مؤشر
RSI
BTCUSD
+5
مؤشر
MACD
Forex
+1
مؤشر
EMA
SMA
+3
مؤشر
مؤشر
Key Levels
Liquidity Grab
+1
مؤشر
AI
ATR
+26
مؤشر
SMC
Breakout
+1
مؤشر
مؤشر
ATR
RSI
+14
مؤشر
Doji
Engulfing
+1
مؤشر
ADX
ATR
+5
مؤشر
Forex
EURUSD
+3
مؤشر
AI
MACD
+8
شعار "Anchored VWAP Buttons"
الأعلى تقييمًا
4.6
(5)
مجاني
مؤشر
VWAP

السعر