الوصف
مؤشرات متجر Pinescriptlabs: روبوتات cBots متجر Pinescriptlabs : (cBot) اختراق الذهب و BTCنقاط محورية الجلسة(جديد)
خوارزمية ذكية متتبعة(جديد)
دعم SmartTrend و
المقاومة
خطوط
الهيكل السوقي الديناميكي
تحليل
لنقاط
الانعطاف
فيبوناتشي
انحدار خطي
متعدد الأطر الزمنية
متعدد الأطر الزمنية
متعدد المستويات
تتبع تحيز الشمعة
المتعقب
دعم تلقائي و
مقاومة
اتجاه
خطوط
جميع
مستويات الدعم و
المقاومة
المستويات
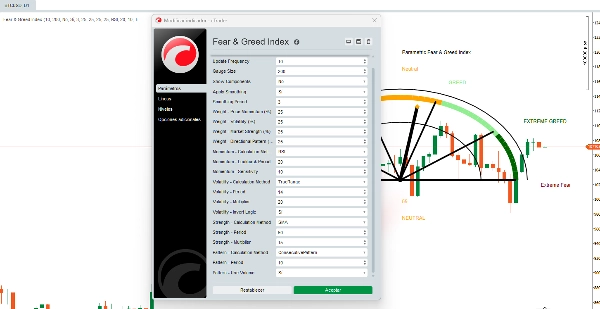
مؤشر الخوف والجشع
مؤشر الخوف والجشع هو خوارزمية بصرية متقدمة تلخص معنويات السوق إلى قيمة من 0 إلى 100 باستخدام مقياس نصف دائري. على عكس الإصدارات الأساسية، هذه الأداة قابلة للتخصيص بالكامل، مما يسمح للمتداولين بضبط كل جانب من جوانب حسابها.
📊 المكونات الأربعة الأساسية (قابلة للتكوين)
1️⃣ زخم السعر *(وزن قابل للتكوين: 0-100%)*
6 طرق حساب متاحة:
- تغير السعر: نسبة التغير البسيطة مقارنة بالفترة السابقة
- معدل التغير (ROC): معدل التغير المعياري
- مؤشر القوة النسبية (RSI): RSI معدل للزخم
- انحراف المتوسط المتحرك البسيط (SMADeviation): انحراف السعر عن SMA
- انحراف المتوسط المتحرك الأسي (EMADeviation): انحراف السعر عن EMA
- MACD: إشارة MACD كمؤشر زخم
🔧 معلمات قابلة للتخصيص:
- فترة النظر للخلف *(5-100)*
- حساسية الحساب *(1.0-50.0)*
2️⃣ التقلب *(وزن قابل للتكوين: 0-100%)*
6 طرق حساب متاحة:
- النطاق الحقيقي (TrueRange): التقلب بناءً على النطاق الحقيقي
- نطاق الأعلى-الأدنى (HighLowRange): نطاق بسيط بين الأعلى والأدنى
- إغلاق إلى إغلاق (CloseToClose): تقلب إغلاق إلى إغلاق لوغاريتمي
- متوسط النطاق الحقيقي (ATR): متوسط النطاق الحقيقي القياسي
- الانحراف المعياري (StandardDev): الانحراف المعياري للسعر
- تقلب باركنسون (ParkinsonVol): مقدر تقلب باركنسون
🔧 معلمات قابلة للتخصيص:
- فترة الحساب *(5-50)*
- مضاعف التقلب *(1.0-100.0)*
- عكس المنطق (تقلب أعلى = خوف أكبر)
3️⃣ قوة السوق *(وزن قابل للتكوين: 0-100%)*
6 طرق حساب متاحة:
- SMA: الموضع بالنسبة للمتوسط المتحرك البسيط
- EMA: الموضع بالنسبة للمتوسط المتحرك الأسي
- VWAP: الموضع بالنسبة لسعر المتوسط المرجح بالحجم
- HLBand: الموضع داخل نطاق الأعلى-الأدنى
- BollingerPos: الموضع داخل نطاقات بولينجر
- PivotDistance: المسافة إلى نقاط المحور
🔧 معلمات قابلة للتخصيص:
- فترة الحساب *(10-200)*
- مضاعف القوة *(1.0-50.0)*
4️⃣ النمط الاتجاهي *(وزن قابل للتكوين: 0-100%)*
6 طرق حساب متاحة:
- نسبة الثيران والدببة (BullBearRatio): نسبة الشموع الصاعدة/الهابطة
- نمط الحجم (VolumePattern): تحليل اتجاه الحجم
- نمط حجم الجسم (BodySizePattern): تحليل حجم جسم الشمعة
- نمط الفتيل (WickPattern): تحليل نمط الفتيل
- نمط الفجوة (GapPattern): الكشف عن الفجوات وتحليلها
- النمط المتتالي (ConsecutivePattern): تحليل حركة السعر المتتالية
🔧 معلمات قابلة للتخصيص:
- فترة التحليل *(5-30)*
- استخدام الحجم في الحسابات (اختياري)
⚙️ الميزات المتقدمة
🔹 نظام وزن مرن
- أوزان مخصصة لكل مكون *(0-100%)*
- تطبيع تلقائي إذا لم تجمع الأوزان إلى 100%
- تحذيرات للإعدادات الفرعية غير المثلى
🔹 تنعيم ذكي
- تنعيم اختياري لتقليل الضوضاء
- فترة تنعيم قابلة للتعديل *(1-10)*
- تطبيق فلتر SMA على النتائج النهائية
🔹 عرض قابل للتخصيص بالكامل
- حجم المقياس *(50-500px)*
- تردد التحديث *(1-50 شريط)*
- تفصيل المكونات اختياري (يعرض القيم الفردية)
- يتكيف تلقائيًا مع الأداة والإطار الزمني
🔄 عملية الخوارزمية
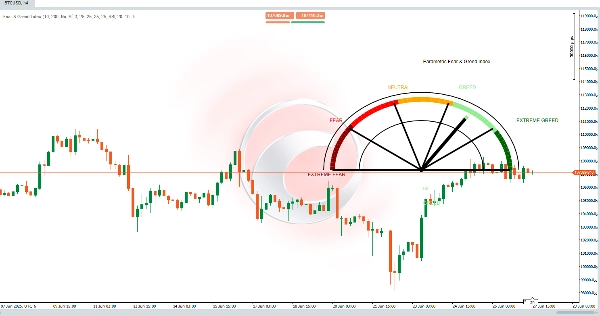
الخطوة 4: التصور
يعرض المقياس نصف الدائري 5 مناطق لونية:
- 0-20: خوف شديد
- 21-40: خوف
- 41-60: محايد
- 61-80: جشع
- 81-100: جشع شديد
✅ نظام قابل للتخصيص بالكامل:
🎯 مرونة كاملة
- يتكيف مع أي سوق: الفوركس، العملات الرقمية، الأسهم، السلع
- خاص بالإطار الزمني: إعدادات مختلفة لـ التداول السريع مقابل التداول المتأرجح
- يتطور مع السوق: تعديل الاستراتيجيات مع تغير الظروف
الملخص
تقييمات العملاء
5 | 100 % | |
4 | 0 % | |
3 | 0 % | |
2 | 0 % | |
1 | 0 % |