


Descrizione
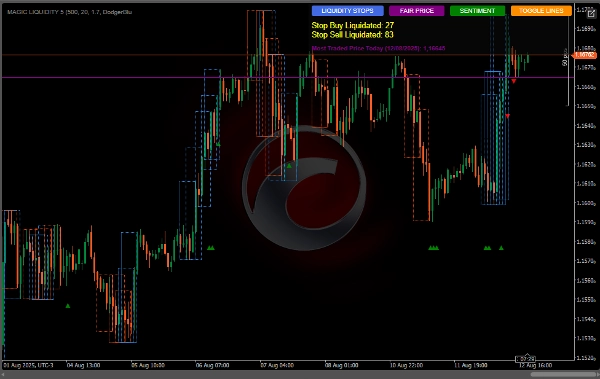
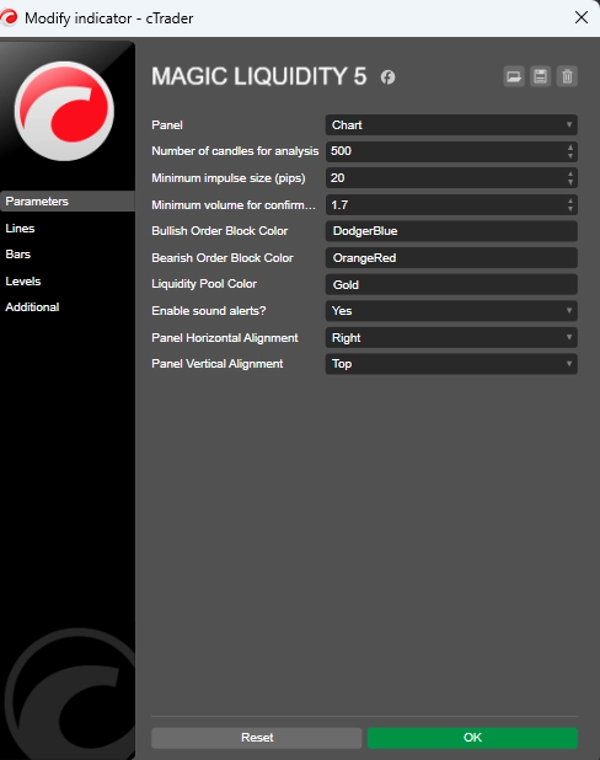
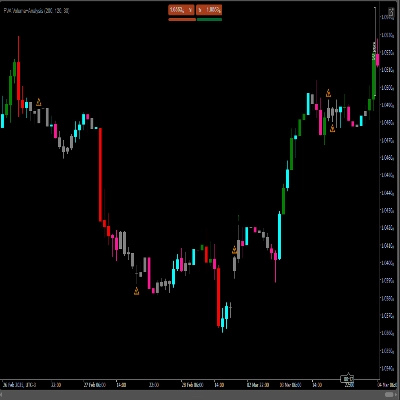
L'indicatore MagicLiquidity è uno strumento avanzato che identifica zone di liquidità, blocchi di ordini e livelli di stop-loss nel mercato, aiutando i trader a individuare aree chiave di supporto/resistenza e potenziali punti di inversione.
Concetti principali
Blocchi di ordini: Aree in cui i grandi partecipanti al mercato potrebbero aver piazzato ordini significativi
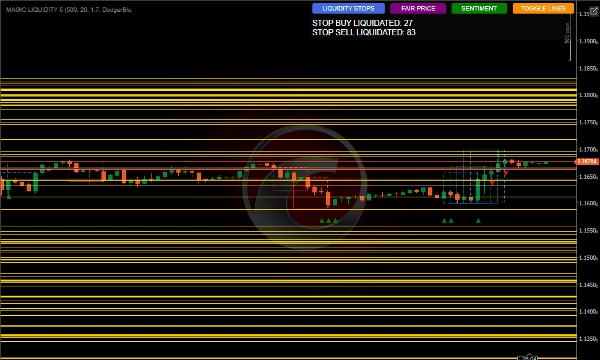
Pool di liquidità: Livelli in cui c'è una concentrazione di stop o ordini pendenti
Prezzo più scambiato Prezzo equo: Il livello di prezzo con il volume di scambio più alto della giornata
Come funziona l'indicatore
Identificazione dei blocchi di ordini
Rileva movimenti impulsivi di una dimensione minima configurabile in pips
Identifica consolidamenti dopo questi movimenti
Classifica come blocco rialzista o ribassista in base alla direzione dell'impulso
Rilevamento dei pool di liquidità
Identifica massimi e minimi nel periodo analizzato
Traccia livelli sopra e sotto il prezzo corrente
Conta quanti pool di liquidità sono stati liquidati raggiunti
Pannello informativo
Mostra il conteggio degli stop buy/sell liquidati
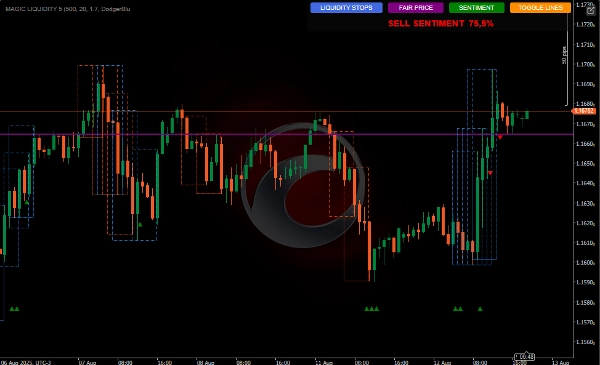
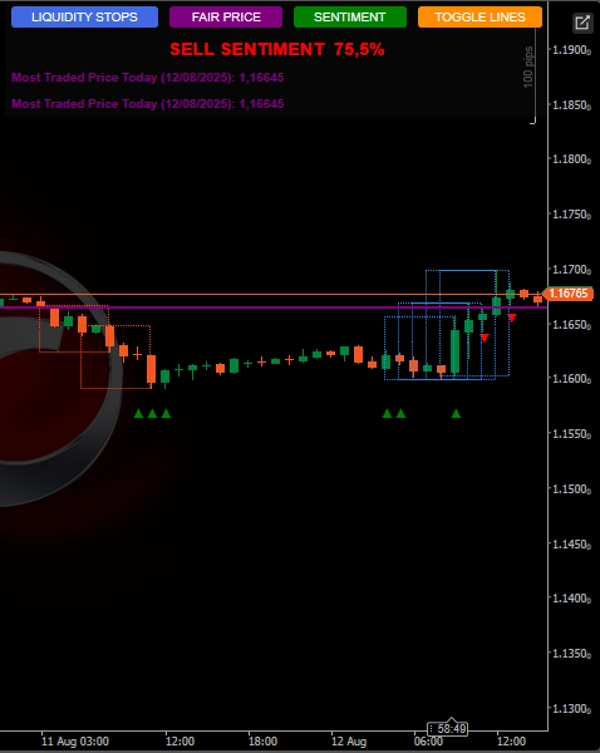
Visualizza il sentiment di mercato rialzista/ribassista
Mostra il prezzo più scambiato della giornata
Permette di abilitare/disabilitare la visualizzazione delle linee
Conferma del volume
Pattern di inversione
Stop loss sopra il blocco
Liquidità di trading
Liquidazione Buy Stop: Quando il prezzo raggiunge un pool di liquidità superiore:
Può indicare esaurimento degli acquisti - prepararsi a vendere
Entrata dopo conferma di inversione
Liquidazione Sell Stop: Quando il prezzo raggiunge un pool di liquidità inferiore:
Può indicare esaurimento delle vendite - prepararsi a comprare
Entrata dopo conferma di inversione
Uso del sentiment
Quando ci sono più pool di liquidità liquidati sopra: bias lato vendita
Quando ci sono più pool di liquidità liquidati sotto: bias lato acquisto
Usare come filtro per allineare le operazioni con il sentiment prevalente
Prezzo più scambiato (Prezzo equo)
Può servire come livello di pareggio
Operazioni sopra: bias rialzista
Operazioni sotto: bias ribassista
Può essere usato come target o punto di inversione
.
Riepilogo
Key features include detection of liquidity pools—areas with concentrated stop or pending orders—above and below the current price, and tracking how many of these pools have been liquidated. An integrated information panel displays the count of buy and sell stops liquidated, market sentiment bias (bullish or bearish), and the most traded price of the day, which serves as a fair price reference.
The tool supports volume confirmation and reversal pattern recognition, offering stop-loss placement guidance above order blocks. It interprets buy stop liquidation as potential buying exhaustion signaling a sell opportunity after reversal confirmation, and sell stop liquidation as potential selling exhaustion signaling a buy opportunity.
Market sentiment is derived from the relative liquidation of liquidity pools, providing a bias filter for trade alignment. The most traded price can act as a breakeven level, target, or reversal point, with trading above it indicating bullish bias and below it indicating bearish bias.
Recensioni dei clienti
Discussioni
Domande frequenti

























Prezzo