


Descrizione
L'IDEA
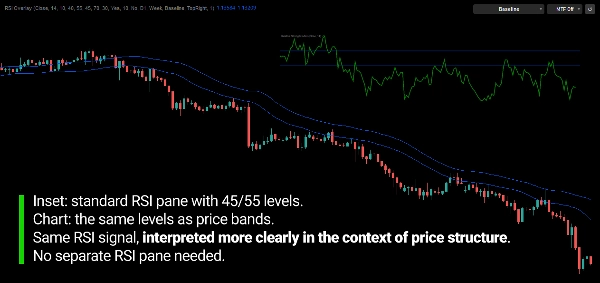
Un RSI che trasforma i suoi livelli in prezzo e li traccia direttamente sul grafico, mantenendo momento e prezzo nello stesso spazio invece che in un pannello separato.
IL PROBLEMA
L'RSI viene normalmente letto in un pannello separato.
Per usarlo, devi costantemente confrontare un valore dell'oscillatore con ciò che il prezzo sta facendo sul grafico principale.
Livelli come 70, 30 o 50 sono numeri su un oscillatore. Non ti dicono dove il prezzo deve essere affinché l'RSI li raggiunga.
Quindi continui a tradurre a occhio: "L'RSI è a 62 — dove si trova questo sul grafico?"
Il problema non è l'RSI in sé.
Il problema è che momento e prezzo sono mostrati in due posti diversi, in due unità diverse.
IL CONCETTO FONDAMENTALE: I LIVELLI RSI DIVENTANO LIVELLI DI PREZZO.
L'RSI tradizionale chiede:
"Qual è il valore dell'RSI in questo momento?"
RSI Overlay chiede:
"A quale prezzo l'RSI raggiungerebbe questo livello?"
Ogni livello RSI viene convertito nel corrispondente livello di prezzo e tracciato direttamente sul grafico.
L'oscillatore non è più qualcosa che leggi in una finestra e traduci in un'altra.
La sua informazione è espressa nella stessa scala di prezzo del movimento che stai già analizzando.
L'RSI imposta il livello. Il grafico lo mostra in termini di prezzo.
COSA FA
RSI Overlay converte i riferimenti RSI selezionati in livelli di prezzo dinamici e li visualizza direttamente sul grafico principale.
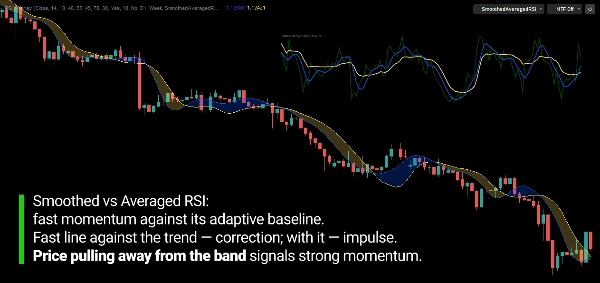
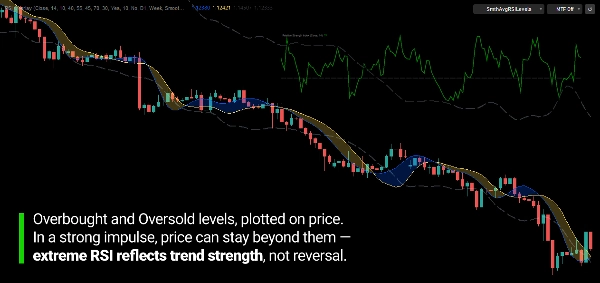
Le Baseline Bull e Bear, i livelli di ipercomprato e ipervenduto, e due riferimenti basati su RSI, Smoothed RSI e Averaged RSI, sono tutti rappresentati come linee di prezzo.
Le linee si aggiornano con ogni nuova barra, quindi continuano a riflettere lo stato più recente dell'RSI invece di rimanere fisse a un prezzo storico.
Questi non sono livelli convenzionali di supporto o resistenza.
Rappresentano il prezzo al quale il corrispondente valore RSI sarebbe raggiunto sotto il calcolo RSI attuale.
L'indicatore non cerca di prevedere dove andrà il prezzo.
Mostra dove si trova il prezzo rispetto ai livelli RSI che stai osservando.
COME FUNZIONA
- L'RSI è calcolato usando la smussatura di Wilder.
- Ogni livello RSI è convertito nel prezzo che lo produrrebbe.
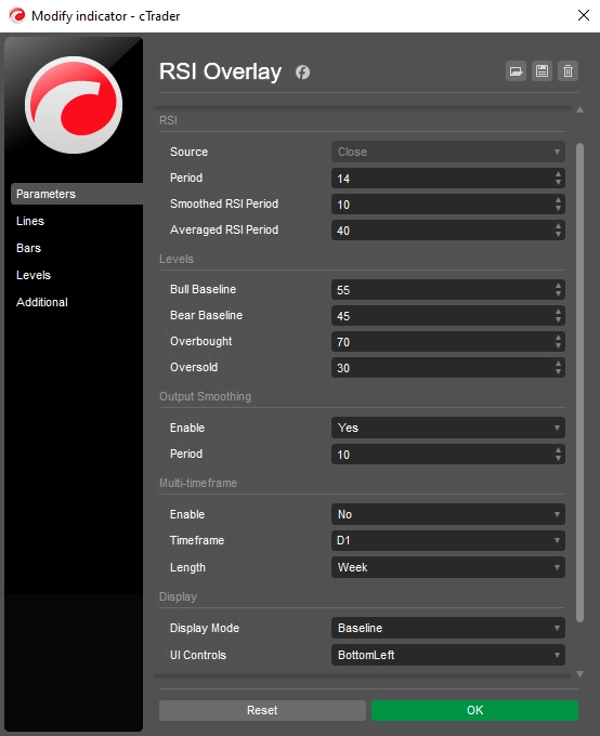
- Le Baseline Bull e Bear segnano la zona di momentum attorno alla linea centrale (default 55 / 45).
- I livelli di ipercomprato e ipervenduto sono convertiti allo stesso modo (default 70 / 30).
- Smoothed RSI e Averaged RSI sono anch'essi convertiti in linee di prezzo.
I RIFERIMENTI RSI
Baseline Bull / Bear
I livelli di prezzo ai quali l'RSI entrerebbe nel territorio di momentum rialzista o ribassista. Lo spazio tra di essi mostra dove il momentum è neutro.
Smoothed RSI
Una versione dell'RSI con rumore ridotto, mostrata come linea di prezzo che reagisce in modo più fluido.
Averaged RSI
Una media adattiva più lenta dell'RSI, mostrata come linea di prezzo. Fornisce un riferimento di momentum più stabile.
Ipercomprato / Ipervenduto
I livelli di prezzo ai quali l'RSI raggiungerebbe le soglie di ipercomprato e ipervenduto.
Questi riferimenti non sono segnali automatici.
La loro posizione rispetto al prezzo, e tra di loro, fornisce un contesto su come si sta sviluppando il momentum.
CONTESTO MULTI-TIMEFRAME
L'RSI non deve necessariamente provenire dal timeframe del grafico che stai visualizzando.
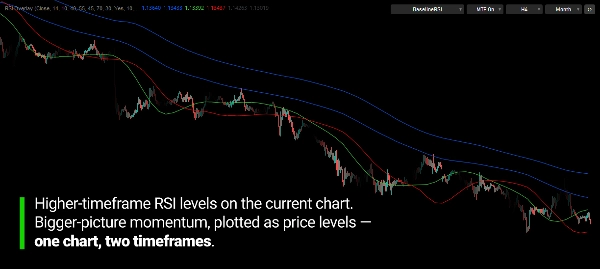
Per esempio, un RSI settimanale o mensile può essere proiettato su un grafico H1.
Questo posiziona il quadro di momentum di timeframe superiore direttamente sull'azione di prezzo che stai osservando.
Puoi scegliere quanta storia disegnare, dall'ultima ora fino a diversi anni.
Il timeframe selezionato deve essere superiore al timeframe del grafico.
CONTROLLALO DAL GRAFICO
Undici modalità di visualizzazione ti permettono di mostrare solo ciò di cui hai bisogno, da una coppia pulita di baseline all'intero set di riferimenti RSI.
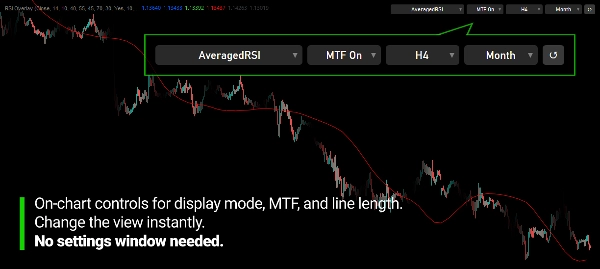
Una barra di controllo compatta sul grafico ti permette di cambiare modalità di visualizzazione, attivare o disattivare il multi-timeframe e modificare timeframe e lunghezza senza riaprire le impostazioni.
Un pulsante di reset riporta tutto ai parametri iniziali.
La barra può essere posizionata in qualsiasi angolo o nascosta.
COS'È POSSIBILE OSSERVARE
L'indicatore è progettato per rendere visibili diverse cose:
- Dove si trova il prezzo rispetto alle zone di momentum rialzista e ribassista
- Quanto il prezzo è distante dai livelli di ipercomprato e ipervenduto, in termini di prezzo
- I cambiamenti di momentum attorno alle baseline
- Ritracciamenti e continuazioni rispetto all'RSI smussato e mediato
- Contesto di momentum di timeframe superiore su un grafico di timeframe inferiore
RSI Overlay è uno strumento di misurazione, non un sistema di acquisto/vendita autonomo.
PROGETTATO PER IL MOMENTUM IN TERMINI DI PREZZO
Lo scopo non è sostituire l'RSI.
È eliminare la necessità di tradurre un oscillatore in prezzo a occhio.
Tutto ciò che sai sull'RSI si applica ancora. Viene semplicemente mostrato dove le decisioni vengono effettivamente prese: sul grafico dei prezzi.
CARATTERISTICHE PRINCIPALI
- Livelli RSI convertiti in livelli di prezzo sul grafico principale
- Baseline Bull e Bear (default 55 / 45)
- Livelli di prezzo di ipercomprato e ipervenduto (default 70 / 30)
- Linea RSI smussata
- Linea RSI mediata
- RSI multi-timeframe su grafici di timeframe inferiore
- Lunghezza di visualizzazione selezionabile per le linee multi-timeframe
- 11 modalità di visualizzazione
- Barra di controllo sul grafico con reset
- Fonte configurabile, periodo RSI, smussatura e media
- Colori personalizzabili, stili di linea e spessore
---
Il trading comporta rischi. Questo indicatore è uno strumento di analisi tecnica e dovrebbe essere utilizzato insieme a una gestione del rischio appropriata.
Riepilogo
It supports multi-timeframe analysis by allowing RSI data from higher timeframes (e.g., weekly or monthly) to be displayed on lower timeframe charts, providing broader momentum context. Users can customize display modes, line styles, colors, and control parameters directly from an on-chart control bar, which includes options to reset settings and adjust timeframe and length without reopening menus.
RSI Overlay serves as a measurement tool to visualize where price stands relative to momentum zones and RSI thresholds in price terms. It does not generate automatic trading signals but aids in observing momentum shifts, pullbacks, and continuations aligned with RSI levels on the price chart.
Recensioni dei clienti
5 | 100 % | |
4 | 0 % | |
3 | 0 % | |
2 | 0 % | |
1 | 0 % |
Discussioni
Domande frequenti
Altro da questo autore












![Logo di "High-Low Divergence [Iridio Capital]"](https://cdn.ctrader.com/image/webp/10a9e91b-243a-43f6-bbfe-7376bad5a214_61554)










Prezzo