

Descrizione
L'IDEA
Quattro strumenti di Fibonacci e tre strumenti geometrici che condividono la stessa struttura di swing rilevata automaticamente invece di basarsi su riferimenti manuali separati.
IL PROBLEMA
L'analisi geometrica diventa tediosa quando ogni strumento richiede la propria selezione di swing.
Trova lo swing.
Disegna il ritracciamento.
Trova di nuovo lo stesso swing.
Disegna il ventaglio.
Trova tre swing per la forchetta.
Regola il canale.
Poi ridisegna tutto quando il prezzo crea un nuovo swing.
Ma c'è un altro problema oltre al lavoro manuale.
Quando ogni strumento è costruito indipendentemente, possono finire per usare riferimenti di swing leggermente diversi.
Il ritracciamento può descrivere un movimento.
Il ventaglio può descriverne un altro.
La forchetta può usare una sequenza di tre punti diversa.
Le proiezioni risultanti possono sembrare utili individualmente mentre in realtà descrivono parti diverse del mercato.
Il problema non è solo ridisegnare la geometria. È mantenere la geometria collegata alla stessa struttura sottostante.
IL CONCETTO FONDAMENTALE: GLI SWING SONO AUTOMATICI. LA GEOMETRIA RIMANE COERENTE.
Auto-Draw Fibonacci Suite rileva una volta sola la struttura di swing sottostante.
Gli strumenti geometrici abilitati usano quindi automaticamente quella stessa struttura.
Questo crea un sistema di riferimento comune tra diverse misurazioni geometriche.
Una mappa di swing. Molteplici viste geometriche.
La geometria può cambiare man mano che la struttura di swing si sviluppa, mentre il riferimento sottostante rimane coerente.
L'obiettivo non è creare sette segnali indipendenti.
È lasciare che diversi strumenti geometrici descrivano la stessa struttura di mercato.
COSA FA
L'indicatore automatizza la costruzione e la manutenzione di sette strumenti geometrici:
- Ritracciamento di Fibonacci
- Espansione di Fibonacci
- Ventaglio di Fibonacci
- Zone temporali di Fibonacci
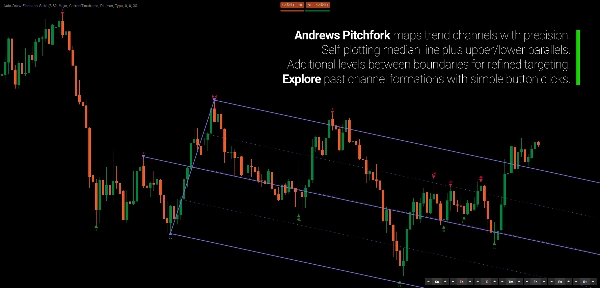
- Forchetta di Andrews
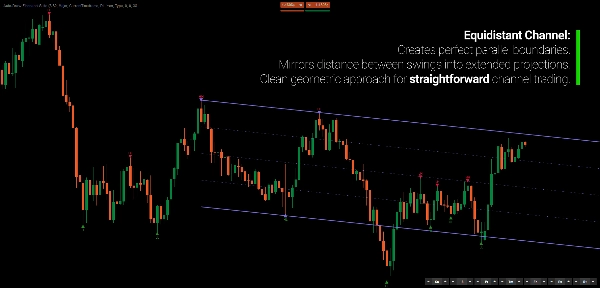
- Canale equidistante
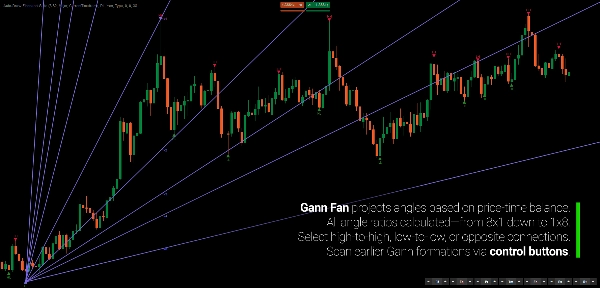
- Ventaglio di Gann
Invece di selezionare e aggiornare manualmente i punti di riferimento per ogni strumento, la suite li ricava dal suo rilevamento comune degli swing.
Quando si sviluppa un nuovo swing, le proiezioni rilevanti si aggiornano automaticamente.
La geometria segue la struttura.
COME FUNZIONA
Il processo è volutamente semplice.
1. Rileva gli swing.
L'indicatore identifica i punti di swing usando il suo motore di rilevamento basato sulla regressione.
2. Costruisci la struttura di swing.
Gli swing sono classificati e organizzati in una sequenza coerente.
3. Proietta la geometria.
Ogni strumento abilitato usa automaticamente i riferimenti di swing appropriati.
4. Lascia che il prezzo si sviluppi.
Quando si forma un nuovo swing, le proiezioni attive si aggiornano.
Non ridisegni sette strumenti.
La geometria segue la struttura.
SETTE STRUMENTI. UN SISTEMA DI RIFERIMENTO.
La suite include quattro strumenti basati su Fibonacci:
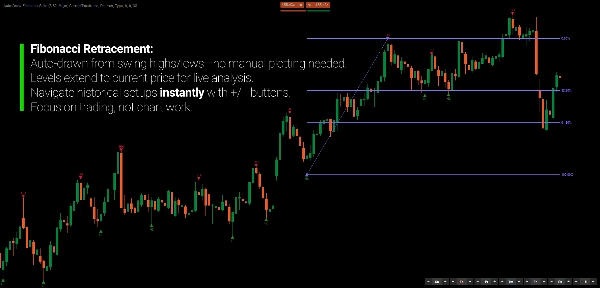
Ritracciamento di Fibonacci
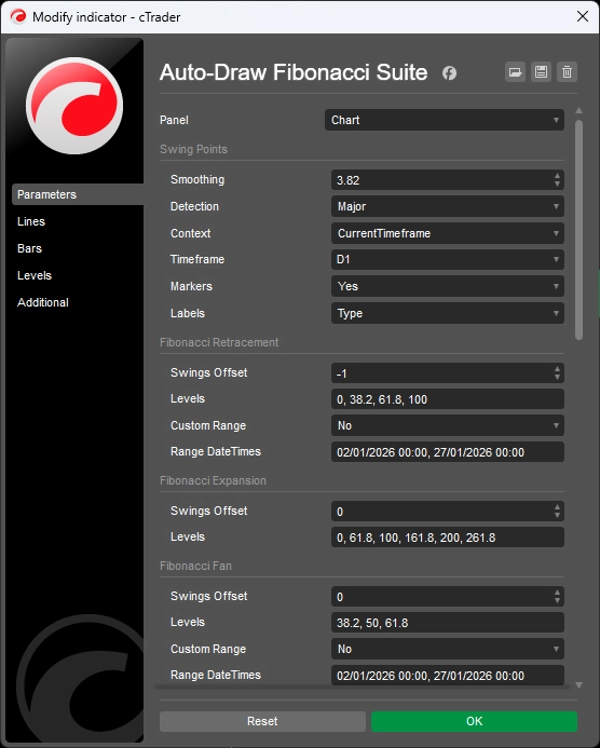
Livelli proporzionali orizzontali tra swing strutturali, inclusi 0%, 38,2%, 61,8% e 100%.
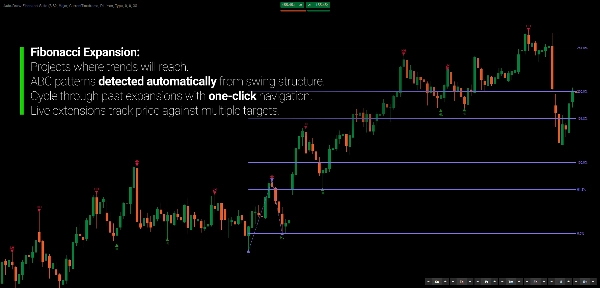
Espansione di Fibonacci
Proietta relazioni di Fibonacci oltre il terzo swing.
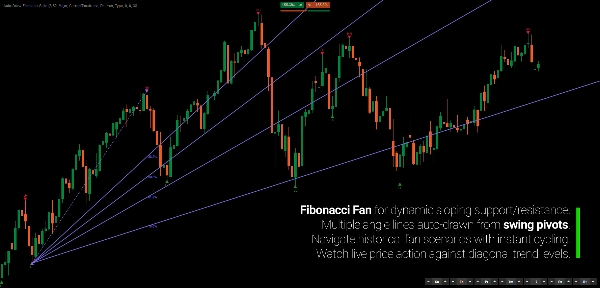
Ventaglio di Fibonacci
Proietta relazioni diagonali di Fibonacci dai pivot strutturali.
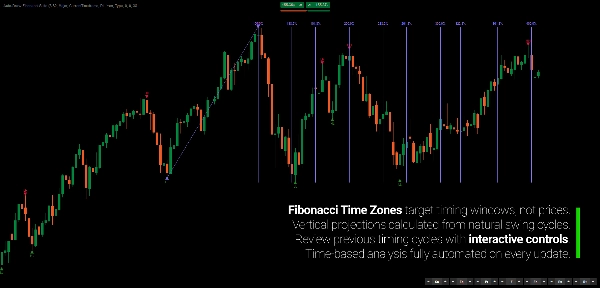
Zone temporali di Fibonacci
Proietta intervalli basati su Fibonacci lungo l'asse temporale.
E tre strumenti geometrici complementari:
Forchetta di Andrews
Un quadro mediano a tre punti con canali paralleli.
Canale equidistante
Confini di prezzo paralleli con livelli intermedi.
Ventaglio di Gann
Proiezioni angolari prezzo-tempo attraverso molteplici rapporti geometrici, inclusi 8x1, 4x1, 2x1, 1x1, 1x2 e altri.
Ogni strumento può essere abilitato indipendentemente.
LO SWING VIENE RILEVATO UNA VOLTA
Questa è la base della suite.
Con l'analisi manuale convenzionale, ogni strumento geometrico può finire per usare pivot leggermente diversi.
Auto-Draw Fibonacci Suite li mantiene collegati al medesimo rilevamento di swing sottostante.
Questo dà alle diverse proiezioni un riferimento comune.
La geometria rimane coerente perché la struttura sorgente rimane coerente.
SCEGLI QUANTA STRUTTURA VUOI
Non ogni grafico richiede lo stesso livello di dettaglio.
Scegli tra tre sensibilità di swing:
Maggiore
Meno swing, più ampi per una visione a livello superiore.
Standard
Una visione equilibrata della struttura di swing in sviluppo.
Minore
Swing più dettagliati per esaminare il movimento interno.
Gli swing possono anche essere classificati come:
- HH
- HL
- LH
- LL
Informazioni aggiuntive sugli swing includono profondità, volume e durata. I marcatori visivi distinguono swing confermati, non confermati e interni.
L'obiettivo non è imporre una definizione di struttura a ogni mercato.
Scegli il livello di dettaglio che corrisponde al movimento che stai studiando.
TORNA INDIETRO ATTRAVERSO LA STRUTTURA
La geometria non deve rimanere bloccata all'ultimo swing.
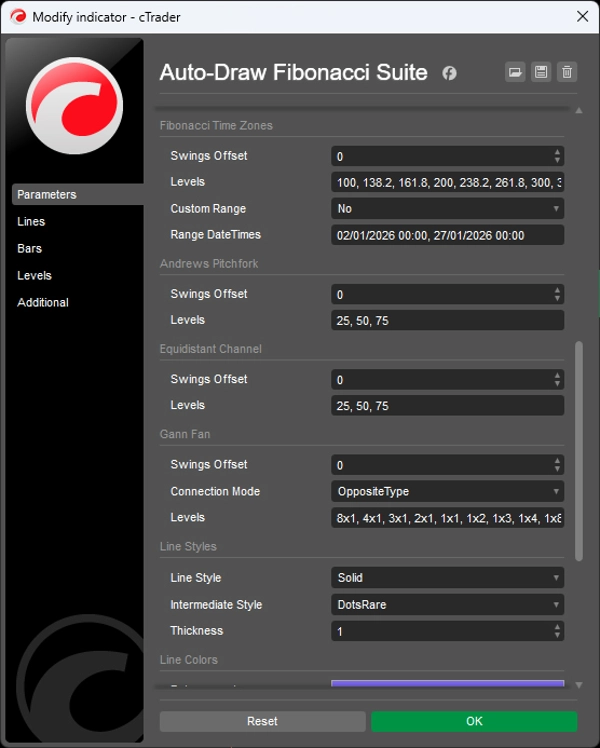
Ogni strumento ha il proprio controllo di offset:
0 → struttura di swing corrente
-1 → struttura precedente
-2 → due strutture indietro
Questo ti permette di esplorare come apparivano le relazioni geometriche in punti precedenti del mercato senza ricostruire manualmente gli strumenti.
Puoi anche cambiare il riferimento di una proiezione senza modificare le altre.
La struttura è automatizzata. Il riferimento rimane sotto il tuo controllo.
GEOMETRIA A TEMPO MAGGIORE SU UN GRAFICO A TEMPO MINORE
Il rilevamento degli swing può provenire da un timeframe superiore mentre le proiezioni geometriche rimangono visibili sul tuo grafico attuale.
Per esempio:
Swing giornalieri → grafico H1
Questo permette al contesto geometrico a timeframe superiore di rimanere visibile mentre analizzi o esegui su un timeframe inferiore.
Nessun cambio ripetuto di timeframe.
Nessuna riproduzione manuale degli swing a timeframe superiore.
LA GEOMETRIA È UN LINGUAGGIO DI MISURAZIONE
Rapporti di Fibonacci, forchette, canali, ventagli e proiezioni temporali non devono essere trattati come previsioni.
Forniscono modi diversi di descrivere le relazioni tra prezzo, tempo e movimento precedente.
Un ritracciamento descrive il movimento proporzionale del prezzo.
Un ventaglio descrive relazioni diagonali.
Una zona temporale descrive la spaziatura temporale.
Un canale descrive un movimento parallelo.
Una forchetta descrive relazioni mediane.
Quando diverse proiezioni convergono, puoi esaminare quella convergenza come una relazione geometrica attraverso diverse dimensioni di misurazione.
La geometria descrive il mercato. Non causa il mercato.
PROGETTATO PER L'ANALISI, NON PER INSEGUIRE SEGNALI
Auto-Draw Fibonacci Suite non è un sistema di segnali di acquisto/vendita.
È uno strumento di automazione per trader che già usano l'analisi di Fibonacci e geometrica ma non vogliono passare il loro tempo a mantenere i disegni.
Usalo per studiare:
- Ritracciamenti
- Espansioni
- Proiezioni di swing
- Confluenza geometrica
- Canali di prezzo
- Relazioni prezzo-tempo
- Struttura a timeframe superiore
- L'evoluzione delle relazioni geometriche mentre il prezzo si sviluppa
L'indicatore non decide cosa significa per te una particolare proiezione.
Mantiene la geometria sincronizzata con la struttura che stai studiando.
CARATTERISTICHE PRINCIPALI
- Rilevamento automatico degli swing
- Riferimenti di swing unificati per tutti gli strumenti geometrici
- Quattro strumenti di Fibonacci
- Forchetta di Andrews
- Canale equidistante
- Ventaglio di Gann
- Aggiornamenti geometrici in tempo reale
- Sensibilità degli swing Maggiore / Standard / Minore
- Classificazione HH / HL / LH / LL
- Metriche di profondità, volume e durata degli swing
- Raggruppamento intelligente degli swing per eliminare swing intermedi ridondanti
- Controllo offset indipendente per ogni strumento
- Rilevamento degli swing multi-timeframe
- Strumenti individuali opzionali
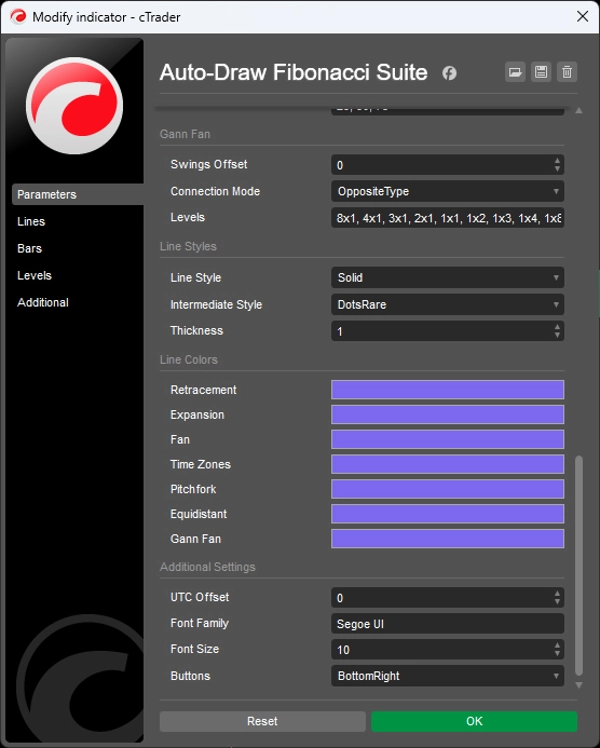
- Livelli di Fibonacci personalizzabili e stili visivi
- Swing sorgente evidenziati
---
Il trading comporta rischi. Questo indicatore è uno strumento di analisi tecnica e dovrebbe essere usato insieme a una gestione del rischio appropriata.
Riepilogo
The indicator employs a regression-based method for swing detection, offering three sensitivity modes (Major, Standard, Minor) to tailor swing granularity. Swings are classified (higher highs, lower lows, etc.) and visually marked for clarity. Users can interactively adjust which historical swings each tool references via offset controls, enabling analysis of past structural relationships independently per tool.
Multi-timeframe support allows applying swing detection from a higher timeframe while viewing a lower timeframe chart, facilitating comprehensive structural analysis without switching views. The suite is customizable in terms of levels, colors, and styles.
Designed for traders familiar with Fibonacci and geometric analysis, it streamlines workflow by automating complex, multi-tool geometric projections, supporting swing and position traders, multi-timeframe analysts, and discretionary traders seeking coherent, real-time updated geometric market structure visualization.
Recensioni dei clienti
Discussioni
Domande frequenti
Altro da questo autore






















Prezzo
