الوصف
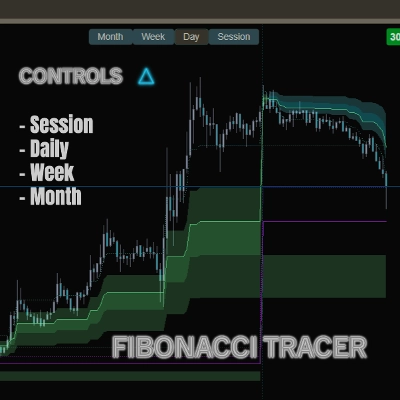
متعقب فيبوناتشي يرسم ويحدث مستويات فيبوناتشي تلقائيًا مع ترك أثر مرئي لتطورها.
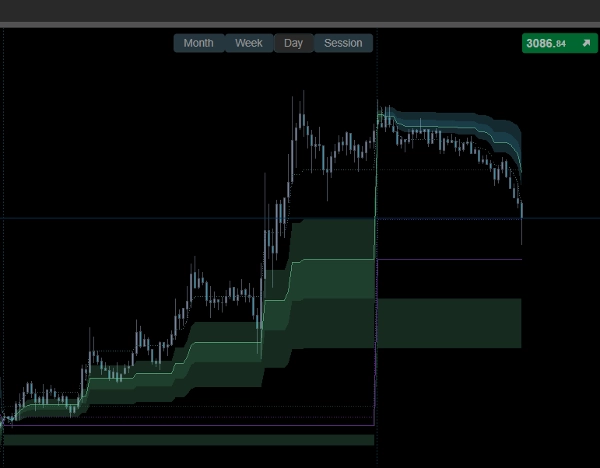
هذا يتيح لك رؤية ليس فقط المستويات الثابتة، بل كيف يتطور فيبوناتشي مع السوق مع مرور الوقت — وهو أمر أهم بكثير من الخطوط المعزولة.
تتيح لك أزرار التحكم السريعة على الرسم البياني التبديل الفوري بين الجلسة، اليومي، الأسبوعي، والشهري، بحيث يمكنك تتبع كيفية تقدم فيبوناتشي عبر أفق زمني مختلف.
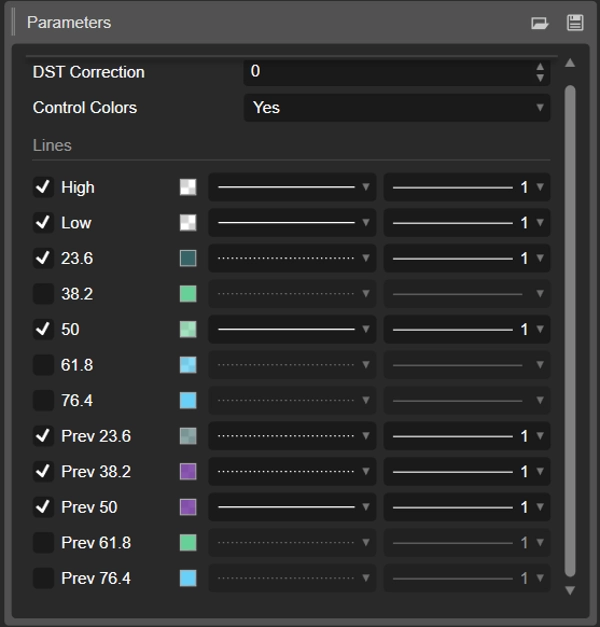
بعد تفعيل المؤشر، افتح الإعدادات وقم بإلغاء تحديد مربعات الاختيار للخطوط (كما هو موضح في الصورة أدناه). هذا يزيل النقاط غير المرغوب فيها ويمنحك نفس المخطط الناعم والصديق للعين كما في صورة الغلاف.
معظم المؤشرات تفتقد التفاصيل الأساسية — فهي تتجاهل انتقالات السوق — عطلات نهاية الأسبوع والتبديل الليلي، عندما تعود السيولة إلى الصفر — وتستمر في الحسابات حيث يلزم إعادة تعيين وقراءة جديدة للسوق؛ هذه مجرد قطعة صغيرة من خبرتي، لكن فهمها يمكن أن يغير بالفعل كيف ترى الأسواق.
الملخص
تقييمات العملاء
5 | 50 % | |
4 | 50 % | |
3 | 0 % | |
2 | 0 % | |
1 | 0 % |


