
설명
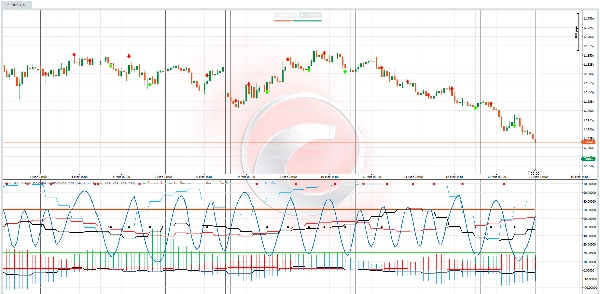
대부분의 트레이더는 가격 움직임이 발생한 후 반응하는 후행 지표에 의존합니다. FFT-SDE 비주얼 엔진 은 근본적으로 다른 정량적 접근 방식을 취합니다. 단순한 오실레이터가 아니라 cTrader에 직접 내장된 실시간 신호 처리 및 예측 도구입니다.
이 엔진은 두 가지 핵심 원칙에 기반합니다:
- 시장은 리듬(주기)을 가진다: 고속 푸리에 변환(FFT) 분석을 사용하여, 이 지표는 가격 움직임을 핵심 주파수 성분으로 분해하고 잡음을 걸러내어 지배적이고 거래 가능한 주기를 드러냅니다. 이를 통해 시장이 언제 전환될 가능성이 있는지 알 수 있습니다.
- 가격 움직임은 통계적 성격을 가진다 (SDE): 가격을 확률 미분 방정식(오른슈타인-울렌벡 과정)으로 모델링하여 시장의 드리프트(모멘텀), 변동성(위험), 평균회귀 속도를 정량화합니다. 이를 통해 시장이 어떻게 움직일 가능성이 있는지와 성공적인 거래의 확률 을 알 수 있습니다.
이 두 세계—주기 분석(FFT) 과 확률 예측(SDE)—를 결합하여 FFT-SDE 엔진은 표준 도구에서는 제공할 수 없는 시장에 대한 총체적 관점을 제공합니다.
2. 핵심 유용성: 어떤 문제를 해결하는가?
트레이더가 이 지표를 사용하여 의사결정을 개선하는 방법은 다음과 같습니다:
- 문제 1: "시장이 추세인지 횡보인지 알 수 없습니다."
-
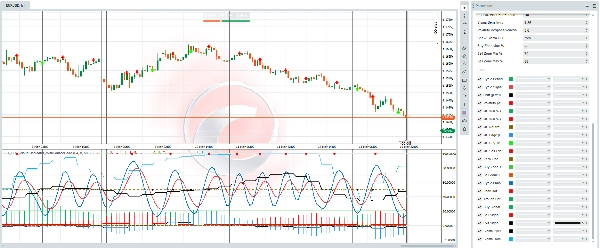
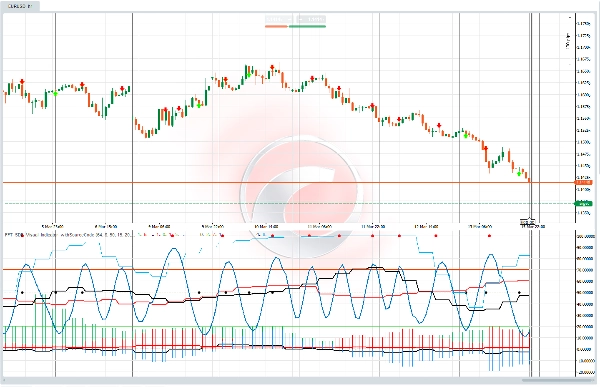
- 해결책 (주기 기간 및 시그마 주기성): 주기 기간 히스토그램은 현재 지배적인 시장 주기의 길이를 즉시 보여줍니다. 주기가 명확하고 강할 때 스윙 거래가 가능합니다. 시그마 주기성 % (변동성 주기)가 높으면 위험의 확장과 수축 기간이 예상되어 포지션 크기를 동적으로 조정할 수 있습니다.
- 문제 2: "진입 타이밍이 항상 너무 이르거나 늦습니다."
-
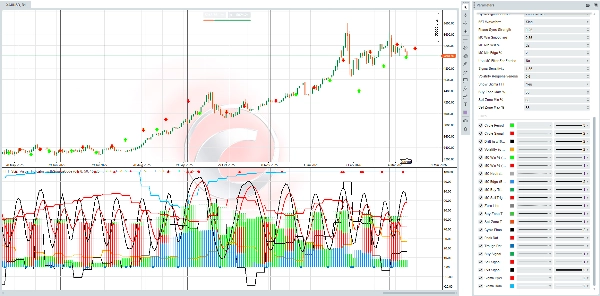
- 해결책 (주기 위상 및 진입 구역): 이 지표는 시장 주기를 부드러운 0-100% 파동—주기 위상 % —으로 매핑합니다. 고점과 저점을 추측하는 대신, 미리 정의된 매수 (0-35%) 및 매도 (60-88%) 구역에 가격이 진입할 때까지 기다릴 수 있습니다. 이들은 임의의 수준이 아니라 시장의 지배적 주파수에서 동적으로 도출된 것으로, 중요한 타이밍 우위를 제공합니다.
- 문제 3: "설정이 성공 확률이 높은지 알 수 없습니다."
-
- 해결책 (몬테카를로 시뮬레이션): 이것이 핵심 기능입니다. 각 바마다 엔진은 현재 시장 역학을 기반으로 수백 개의 시뮬레이션 가격 경로(몬테카를로)를 실행합니다. 그리고 MC 승률 % (매수) 및 MC 승률 % (매도) 를 출력합니다. 이는 감이나 직감이 아니라 1:2.5 위험 대비 보상 거래가 진입하기 전에 성공할 통계적 확률입니다. 실제로 확률이 유리한지 확인할 수 있습니다.
- 문제 4: "기존 지표는 너무 느리고 잡음이 많습니다."
-
- 해결책 (적응형 및 다면적): 이 지표는 정적이지 않습니다. 적응형 변동성 모델은 가격 충격과 주기 충격에 실시간으로 반응합니다. 시그마 FFT 는 변동성 자체가 주기적인지 알려주어 조용하거나 폭발적인 시기를 경고합니다. 모든 구성 요소는 현재 시장 상황에 적응하도록 설계되었습니다.
cTrader 마켓플레이스에서 이러한 기능을 단일하고 일관된 시각적 시스템으로 결합한 다른 지표는 없습니다.
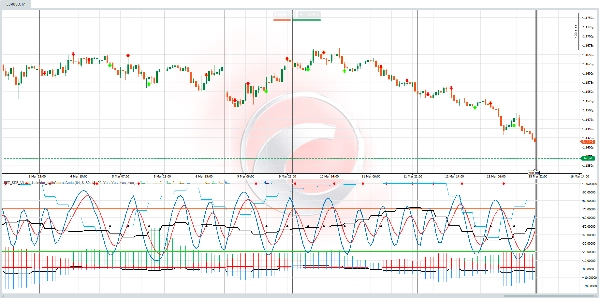
- "시그마 FFT" 레이어: 가격에 주기가 있다는 것을 아는 것과 변동성 자체에 주기가 있다는 것을 아는 것은 전혀 다른 수준의 정교함입니다. 이는 시장 구조 변화를 예측하는 데 큰 우위를 제공합니다.
- 확실성이 아닌 확률적 우위: 몬테카를로 출력은 트레이더가 "성배" 같은 확실성을 추구하는 대신 확률과 우위를 관리하는 전문적인 사고방식으로 나아가게 합니다.
- 완전한 시각화 및 맞춤화: 이 모든 복잡한 수학은 깔끔한 다중 패널 형식으로 제공되며 광범위한 맞춤 설정(27개 이상의 매개변수)을 지원합니다. 스캘핑부터 스윙 트레이딩까지 특정 거래 스타일에 맞게 조정할 수 있습니다.
- 일관된 융합: 매수/매도 신호를 생성하는 주기 위상은 드리프트와 적응형 변동성을 계산하는 데 사용되는 동일한 주기입니다. 지표의 모든 부분이 서로 연계되어 통합되고 일관된 시장 모델을 만듭니다.
이 지표는 다음과 같은 트레이더에게 완벽합니다:
- 후행 지표에 지쳤고 더 예측적이고 과학적인 접근 방식을 원하는 사람.
- 주기, 변동성, 통계적 확률의 가치를 어느 정도 이해하는 사람.
- 견고하고 규칙 기반의 거래 시스템을 구축하고자 하는 사람.
- 주기적 행동을 보이는 상품(예: 외환 쌍, 지수, 금과 같은 원자재)을 거래하는 사람.
- 시장에 진정한 우위를 얻기 위해 전문 등급 도구에 투자할 의향이 있는 사람.
FFT-SDE 비주얼 엔진은 복잡한 정량 금융 개념을 실용적이고 실행 가능한 거래 도구로 변환합니다. 추측에서 확신으로, 반응에서 예측으로 나아가게 합니다. 시장 구조에 대한 깊은 이해와 정량화 가능한 확률적 우위를 갖고 거래할 준비가 되었다면, 이 엔진이 바로 당신이 기다려온 도구입니다.
요약
지표 프로필
지표 카테고리
추세
출력 유형
시각화
신호
필터
데이터 요구 사항
막대만
틱 데이터
지원되는 신호
크로스
다이버전스
추세 강도
고객 리뷰
4.6
리뷰: 3
5 | 67 % | |
4 | 33 % | |
3 | 0 % | |
2 | 0 % | |
1 | 0 % |
고객 리뷰
March 25, 2026
Ngl, this one makes sense if you are not trying to yolo every signal. Keeping it on demo first and see how it behaves when momentum shifts gets messy.
March 22, 2026
This feels useful once the trader already has a plan. The main value is checking stretched conditions, not chasing every signal that appears. The part to watch is whether bad trades cluster too quickly.
March 20, 2026
No need to judge this from 1 good trade. A better check is RSI 30 and 70, 2 swing checks and 25 signals before using a larger account. Better rechecked it on H1 and M15.
상담
자주 묻는 질문(FAQ)
BTCUSD
Crypto
트레이딩 봇, 지표, 플러그인 등 cTrader Store에서 제공되는 상품은 제3자 개발자에 의해 제공되며, 이는 단순히 정보 및 기술적 접근을 목적으로 제공된 것입니다. cTrader Store는 중개인이 아니며, 투자 조언, 개인별 추천 또는 향후 성과에 대한 어떠한 보장도 제공하지 않습니다.
이 작성자의 상품 더 보기


좋아하실 만한 다른 항목


가격
43
판매
306
무료 설치