
설명
RiskLotSizer는 cTrader용 차트 기반 포지션 사이징 및 리스크 관리 지표로, 트레이더가 적절한 거래 크기를 빠르고 시각적으로 계산할 수 있도록 설계되었습니다.
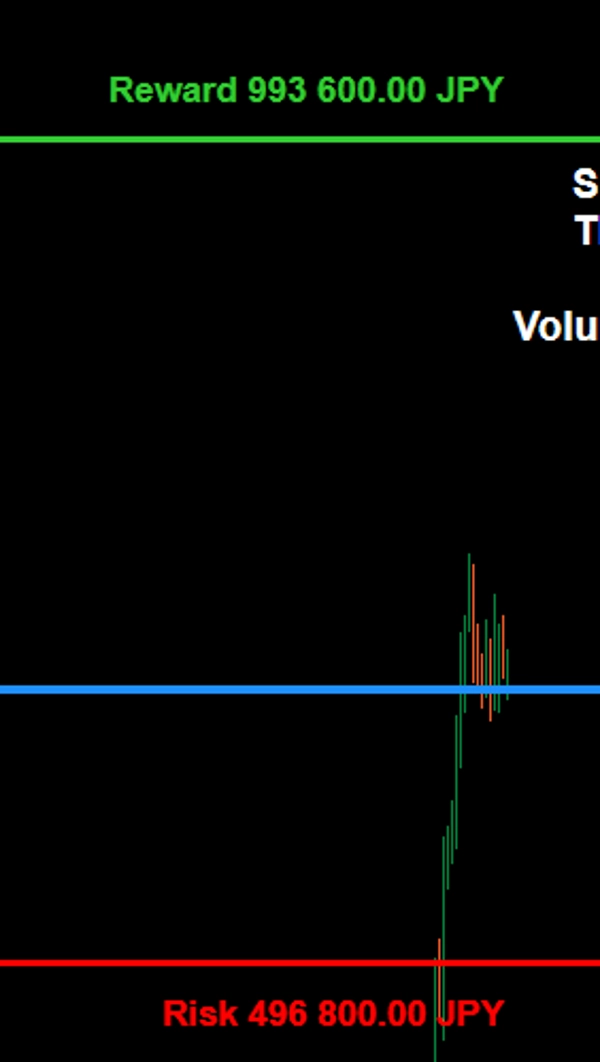
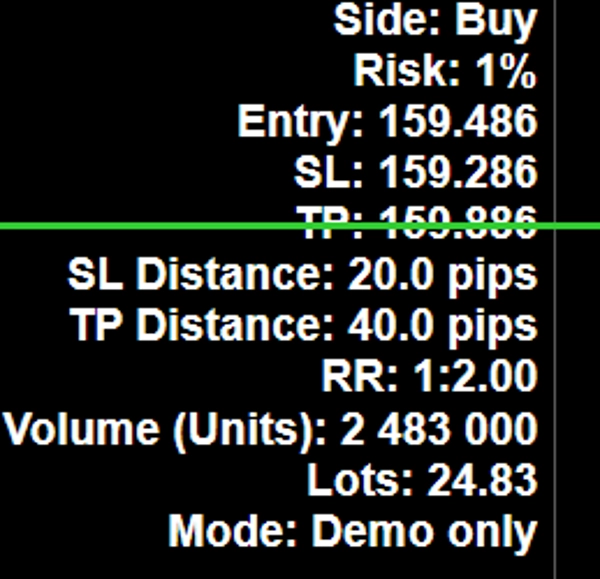
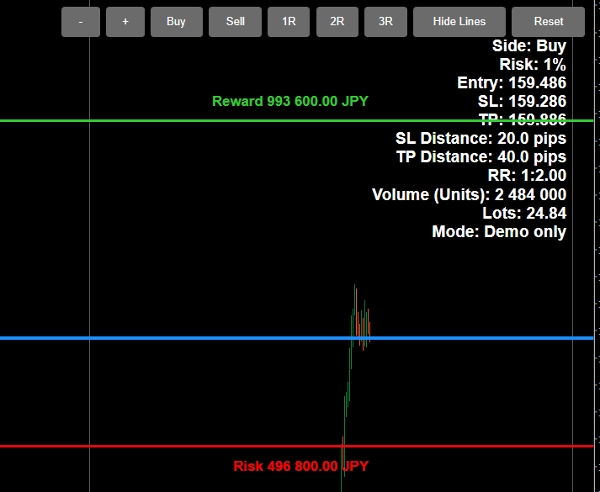
이 지표는 차트에서 직접 진입, 손절, 이익실현 수준을 조정할 수 있어 실시간으로 거래 계획을 세우기 쉽습니다. 계좌 자본의 선택한 리스크 비율에 따라 RiskLotSizer가 자동으로 포지션 크기를 계산하고 예상 로트 크기, 리스크 금액, 보상 금액 및 리스크/보상 비율을 표시합니다.
매수 및 매도 시나리오 모두를 지원하며, 포지션 진입 전에 거래 리스크를 명확하게 시각적으로 보여주도록 설계되었습니다. 리스크 및 보상 값은 SL 및 TP 라인 근처에 직접 표시되며, 주요 정보 패널은 설정에 대한 깔끔한 요약을 제공합니다.
주요 기능은 다음과 같습니다:
- 자본의 선택한 비율에 따른 로트 크기 계산
- 차트에서 직접 조정 가능한 진입, SL, TP 라인
- 포지션 크기, 리스크 금액, 보상 금액 및 RR의 실시간 표시
- 매수 및 매도 모드 모두 지원
- 더 빠른 거래 계획을 위한 빠른 RR 프리셋 버튼
- 영어 및 일본어 지원
- 필요 시 더 깔끔한 차트를 위한 라인 가시성 토글
RiskLotSizer는 재량 트레이더, 데이트레이더 및 일관된 리스크 관리를 유지하면서 더 빠르고 명확한 포지션 사이징 방법을 원하는 모든 사람에게 이상적입니다.
RiskLotSizer は、チャート上で直感的にポジションサイズを計算できる cTrader 用のポジションサイジング・リスク管理インジケーターです。
Entry、Stop Loss、Take Profit の各ラインをチャート上で直接動かしながら、指定した有効証拠金比率に基づく適正ロット数を自動計算します。これにより、トレード前に必要なロット数、想定損失額、想定利益額、Risk/Reward をリアルタイムで把握できます。
Buy / Sell の両方に対応しており、RR プリセットボタンによって利確目標の調整も素早く行えます。また、SL・TP 付近には損失額・利益額が表示されるため、視覚的にも分かりやすく、実践的なトレード設計をサポートします。
主な特長:
- 有効証拠金に対する指定リスク率からロット数を自動計算
- Entry / SL / TP をチャート上で直接調整可能
- ロット数、損失額、利益額、RR をリアルタイム表示
- Buy / Sell の両方に対応
- RR プリセットボタン搭載
- 英語 / 日本語切替対応
- 必要に応じてライン表示の ON / OFF が可能
RiskLotSizer は、裁量トレーダー、デイトレーダー、そして一貫したリスク管理を重視するトレーダーに適したインジケーターです。
요약
고객 리뷰
5 | 0 % | |
4 | 100 % | |
3 | 0 % | |
2 | 0 % | |
1 | 0 % |