説明
━━━━━━━━━━━━━━━━━━━━━━━━━━━━━━━━━━━━━━━━
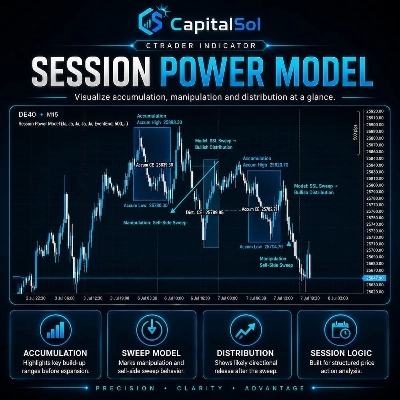
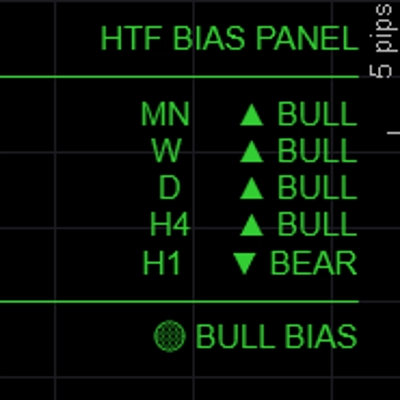
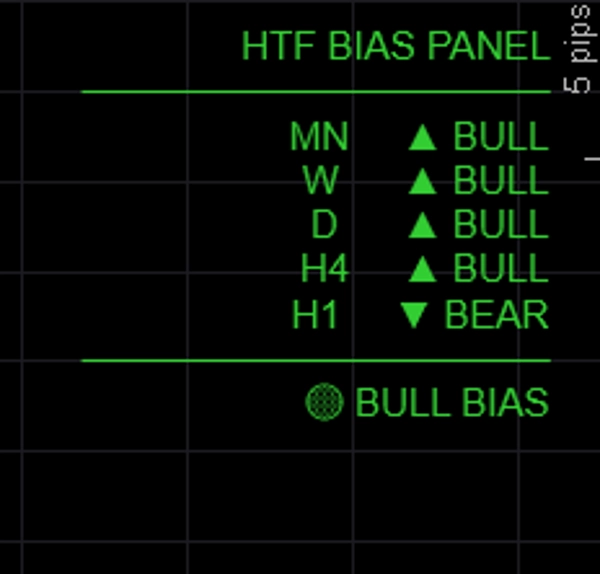
HTFバイアスパネル — バイアス
━━━━━━━━━━━━━━━━━━━━━━━━━━━━━━━━━━━━━━━━
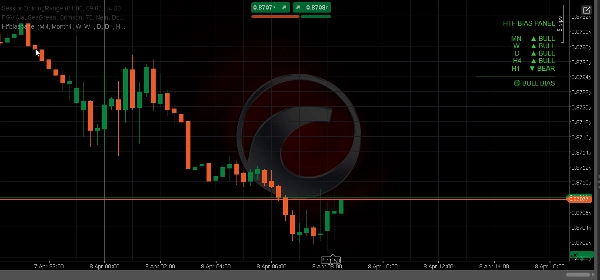
最大5つの時間枠の方向性バイアスを同時にクリーンなチャート上のパネルで表示します。これにより、トレードを始める前に上位時間枠が強気、弱気、または混合かを常に把握できます。
─────────────────────────────
主な特徴
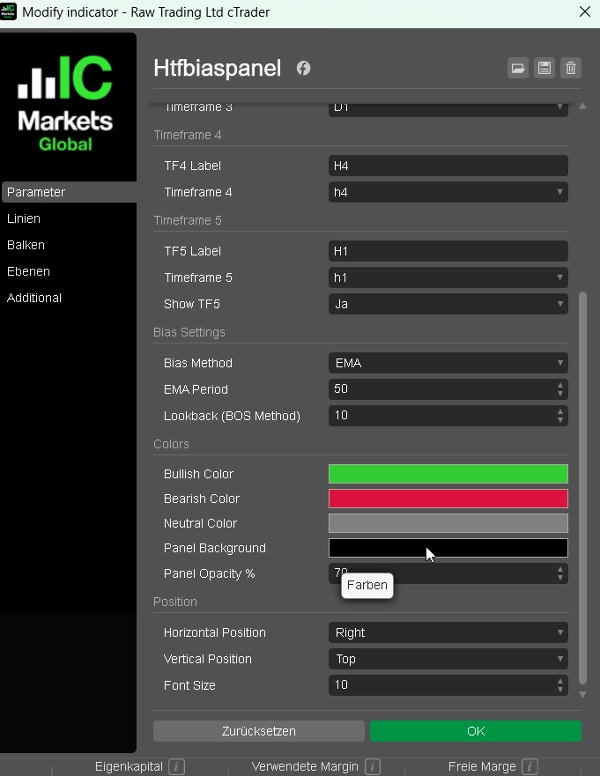
► 5つの完全に設定可能な時間枠 — デフォルトはMN / W / D / H4 / H1、すべてのラベルと時間枠はカスタマイズ可能
► 3つのバイアス判定方法 — セッションごとにバイアスの判定方法を選択可能:
• EMA: EMA(50)の上/下での終値 → トレンドフォローに最も信頼性あり
• 価格対前回終値: 現在の終値と前回の終値の比較 → 反応が早くモメンタムベース
• BOS: 最近のレンジと前のレンジの比較 → 構造に基づくバイアス
► アライメントサマリー — パネル下部にFULL BULL / FULL BEAR / BULL BIAS / BEAR BIAS / NEUTRALを表示
► 色分けされた出力 — 強気は緑、弱気は赤、中立は灰色
► パネル位置 — 左上、右上、中央上、左下、右下に配置可能
► 強気、弱気、中立状態の色を完全にカスタマイズ可能
► 軽量 — チャート描画なし、長方形なし、オーバーヘッドなし
─────────────────────────────
バイアス判定方法の説明
→ EMA(デフォルト):終値がEMA(期間)より上なら強気。最も安定しており、短期のノイズを無視。
→ 価格対前回終値:現在のバーの終値が前のバーの終値より高ければ強気。速く反応的。
→ BOS:最近のNバーのレンジと前のNバーのレンジを比較。高値安値が上昇していれば強気。
─────────────────────────────
デフォルト設定
→ TF1 月足 (MN)
→ TF2 週足 (W)
→ TF3 日足 (D)
→ TF4 4時間足 (H4)
→ TF5 1時間足 (H1)(切り替え可能)
→ バイアス判定方法 EMA
→ EMA期間 50
→ 強気色 ライムグリーン
→ 弱気色 クリムゾン
→ 位置 左上
─────────────────────────────
使い方
1. 任意のチャートにパネルを追加する
2. 好みのバイアス判定方法を選択(初心者にはEMA推奨)
3. トレード前にアライメントサマリーを確認 — BULL BIASまたはFULL BULLのときのみロングを取る
4. HTFバイアスを使ってBOS/CHoCHやFVGインジケーターのシグナルをフィルター — パネルで確認された方向にのみトレードする
5. トレードスタイルに合わせて時間枠を調整(例:スキャルパーはD / H4 / H1 / M15 / M5)
─────────────────────────────
こんな方に最適
✔ ICTおよびスマートマネーコンセプトのトレーダーで、迅速なトップダウン分析が必要な方
✔ 複数時間枠のトレーダーで、素早く視覚的にバイアスを確認したい方
✔ FTMOやプロップファームのトレーダーで、コンフルエンスを重視する方
✔ 上位時間枠のトレンドに逆らったトレードを避けたいすべてのトレーダー
✔ FX、ゴールド、指数、暗号CFDのトレーダー
─────────────────────────────
対応環境
→ プラットフォーム cTrader(デスクトップ&ウェブ)
→ 資産クラス FX、指数、商品、暗号CFD
→ 時間枠 全て(M1からMNまで)
→ アクセス権 不要
→ アカウントタイプ ライブ&デモ
━━━━━━━━━━━━━━━━━━━━━━━━━━━━━━━━━━━━━━━━
概要
カスタマーレビュー
5 | 75 % | |
4 | 25 % | |
3 | 0 % | |
2 | 0 % | |
1 | 0 % |